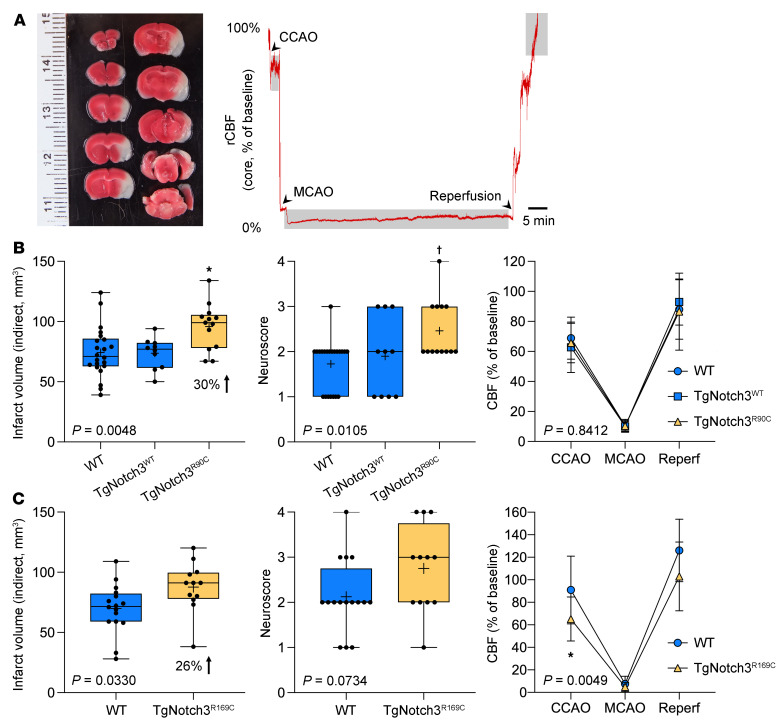
Figure 1. Filament middle cerebral artery occlusion in TgNotch3R90C and TgNotch3R169C cohorts.
(A) Left: A representative image of 2,3,5-triphenyltetrazolium chloride–stained (TTC-stained) coronal sections 24 hours after transient filament middle cerebral artery occlusion (fMCAO). Infarct can be seen as nonstained tissue involving MCA territory. Right: Representative laser Doppler flowmetry (LDF) tracing shows decrease in regional cerebral blood flow (CBF) after common carotid artery occlusion (CCAO) followed by MCAO and reperfusion. Shaded segments indicate where CBF was measured relative to baseline. (B) Infarct volume (indirect method), neurological deficit score, and CBF after CCAO, during MCAO, and after reperfusion in the entire TgNotch3R90C cohort (all ages pooled). In addition to nontransgenic WT mice, transgenic mice overexpressing the human WT Notch 3 (TgNotch3WT mice) were used to control for overexpression in TgNotch3R90C mice. One-way ANOVA followed by Tukey’s multiple comparisons for infarct volume and neurological deficit score (*P = 0.0035 vs. WT, *P = 0.0074 vs. TgNotch3WT; †P = 0.0039 vs. WT, †P = 0.0372 vs. TgNotch3WT) and 2-way ANOVA for repeated measures followed by Šidák’s multiple comparisons for CBF. ANOVA P values are also shown on each panel. Sample sizes are provided in Table 4. (C) Infarct volume (indirect method), neurological deficit score, and CBF after CCAO, during MCAO, and after reperfusion in the entire TgNotch3R169C cohort (all ages pooled, Table 4). Unpaired t test for infarct volume and neurological deficit score, and two-way ANOVA for repeated measures followed by Šidák’s multiple comparisons for CBF (*P = 0.0326, TgNotch3R169C vs. WT). ANOVA P values are also shown on each panel. Mean ± SD. Sample sizes are provided in Table 4.

