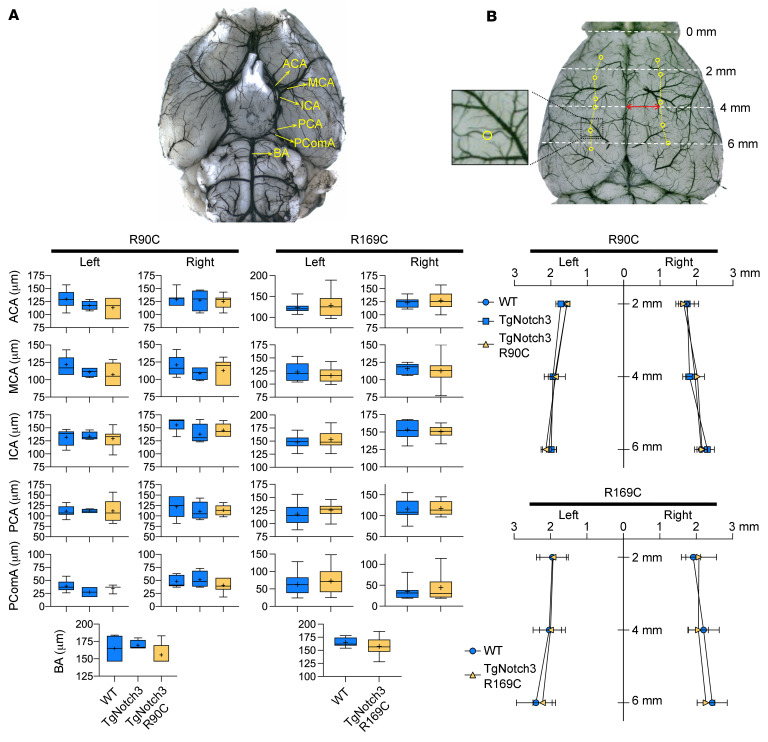
Figure 3. Cerebrovascular anatomy in Notch3R90C and Notch3R169C cohorts.
Representative (A) ventral and (B) dorsal views show the circle of Wills anatomy and pial arterial anastomoses between middle and anterior cerebral arteries. Circles on the dorsal surface in B indicate the pial anastomoses analyzed for their number and distance to midline. ACA, anterior cerebral artery; BA, basilar artery; ICA, internal carotid artery; MCA, middle cerebral artery; PCA, posterior cerebral artery; PComA, posterior communicating artery. The sample size is 39 in total and details are provided in Table 4. One-way ANOVA, 2-way ANOVA, or unpaired t test. Panel A shows diameters of major arteries in the circle of Willis. Panel B shows the distance of pial collaterals from midline. Mean ± SD.

