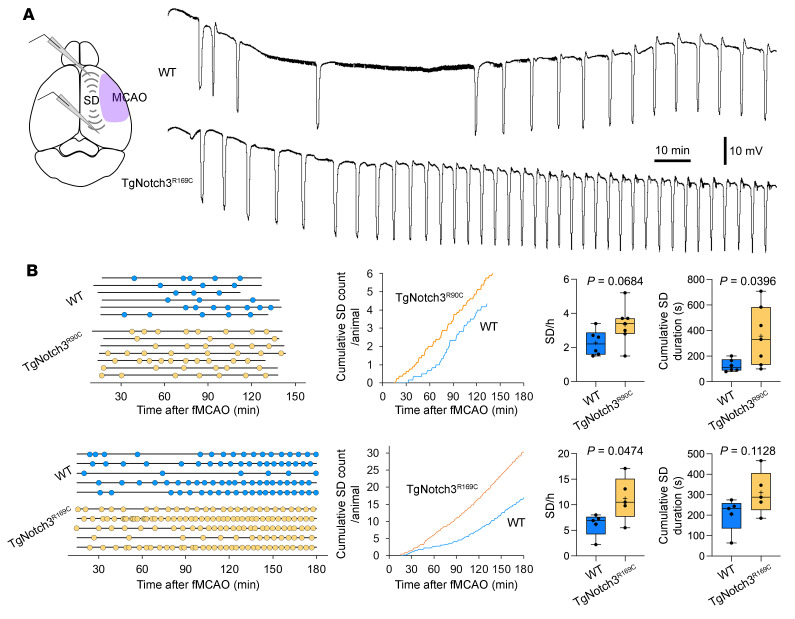
Figure 4. Peri-infarct spreading depolarization during filament middle cerebral artery occlusion in Notch3R90C and Notch3R169C cohorts.
(A) Representative extracellular DC potential recordings from peri-infarct cortex showing higher frequency of peri-infarct spreading depolarizations (SDs) in TgNotch3R169C mice compared with WT mice after filament middle cerebral artery occlusion (fMCAO). Experimental setup shows intracortical glass micropipettes placed outside the ischemic core (purple area) to detect SDs. (B) Left: Experimental timelines showing the time of onset and end of recordings in each mouse, and time of occurrence of SDs (round symbols) in WT and TgNotch3R90C or TgNotch3R169C mice. Middle: Pooled cumulative SD numbers per animal over time after fMCAO. Right: The frequency of SDs and cumulative SD duration in WT and TgNotch3R90C mice or TgNotch3R169C mice. Unpaired t test. Sample sizes are provided in Table 4.

