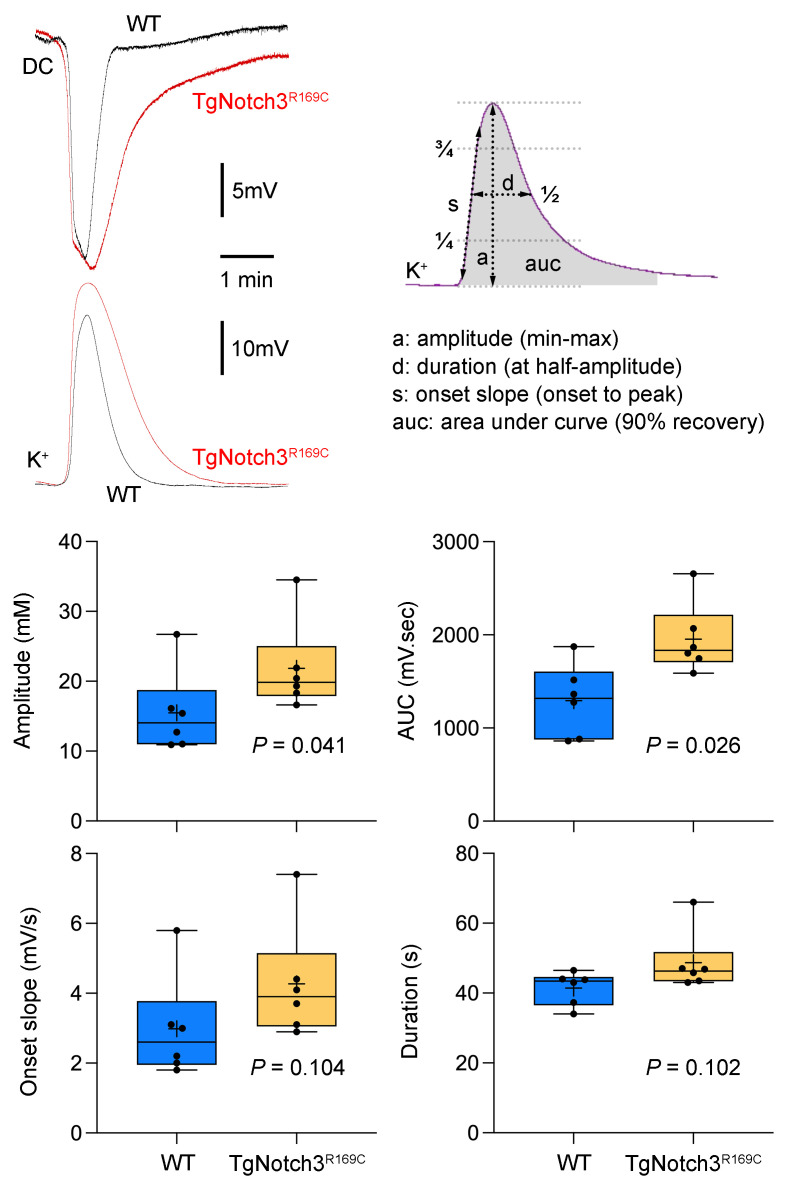
Figure 5. Extracellular K+ rise during spreading depolarizations in nonischemic cortex.
Representative extracellular DC potential and K+-sensitive electrode tracings show the measurement of the amplitude (a), area under curve (auc), onset slope (s), and duration (d) of the K+ surge during an SD. Graphs show these measurements. Unpaired t test for repeated measures. Sample sizes are provided in Table 4. Mean ± standard error.

