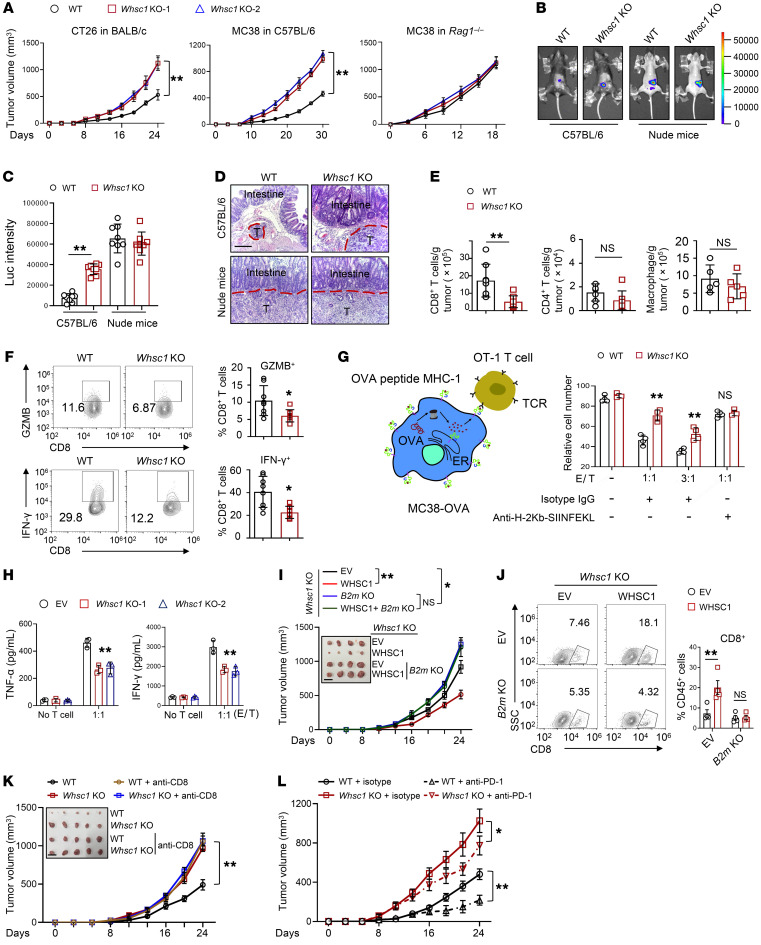
Figure 4. Whsc1 KO induces resistance to antitumor immunity via MHC-I expression.
(A) Effects of Whsc1 loss on CT26 cell–derived (BALB/c) and MC38 cell–derived (C57BL/6 or Rag1–/–) tumor growth (n = 6). (B) Representative luminescence images of cecum xenografts derived from KAP organoids in C57BL/6 or Nude mice after 30 days of injections. (C) Luminescence quantification of cecum xenografts (n = 8). Luc, luciferase. (D) H&E staining of the cecum sections. Scale bars: 200 μm. (E) Flow cytometric analysis of CD8+ T cells, CD4+ T cells, and macrophages in tumors (n = 5–8). (F) Flow cytometric analysis of GZMB+ and IFN-γ+CD8+ T cells (n = 8). (G) Coculturing of OT-1 cells with MC38-OVA. After 48 hours, the viability of MC38-OVA cells was analyzed by flow cytometry (n = 4). Effector to target (E/T) ratios are shown. (H) ELISA assay for T cell effector cytokines following 48 hours of coculturing with MC38-OVA cells (n = 3). (I) Tumor growth in BALB/c mice subcutaneously injected with CT26 cells (n = 6). Scale bar: 1.5 cm. (J) Percentages of CD8+ T cells in tumors (n = 4). The numbers within the quadrants of the plot indicate the percentage of CD8+ T cells among total CD45+ cells. (K) CT26 tumor growth in BALB/c mice treated with anti-CD8 antibody or isotype. The mice were treated every 3 days immediately after tumor cell inoculation (n = 6). Scale bar: 1.5 cm. (L) CT26 subcutaneous tumor growth in BALB/c mice treated with anti–PD-1 antibody or isotype control antibody (n = 6). The mice were treated every 3 days after 8 days of tumor cell implantations. Data are presented as the mean ± SEM. *P < 0.05 and **P < 0.01, by 2-way ANOVA followed by multiple comparisons (A and H–L) and 2-tailed Student’s t test (C and E–G) .

