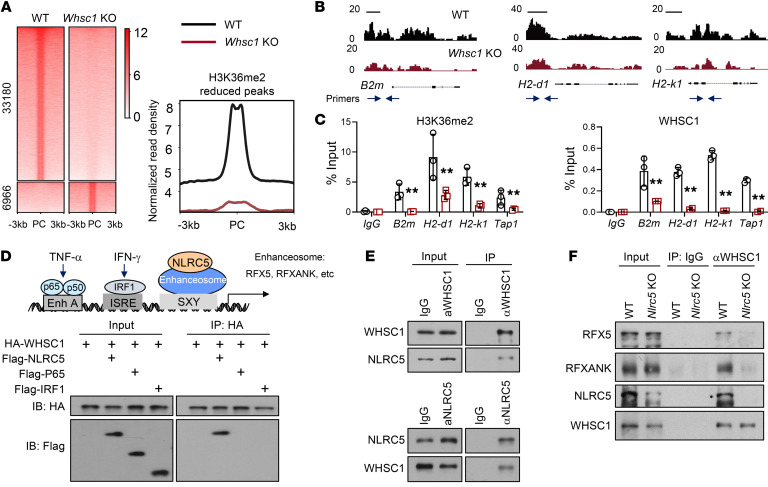
Figure 5. WHSC1 regulates MHC-I expression via interaction with NLRC5.
(A) Heatmaps of H3K36me2 ChIP-Seq signals in WT and Whsc1-KO CT26 cells. Right panel shows quantitation of the reduced H3K36me2 signals. PC, peak center. (B) ChIP-Seq tracks of H3K36me2 signals at the genomic loci of B2m, H2-k1, and H2-d1 genes. Scale bars: 1 kb. (C) ChIP-qPCR analysis of H3K36me2 and WHSC1 signals using the indicated primer pairs (blue arrows in B). (D) Schematic presentation of the cis-regulatory elements in the HLA-B promoter and IB analysis of 293T cell immunoprecipitates. (E and F) IBs analysis of CT26 cell immunoprecipitates. α, anti. Data are presented as the mean ± SEM. **P < 0.01, by 2-tailed Student’s t test (C).

