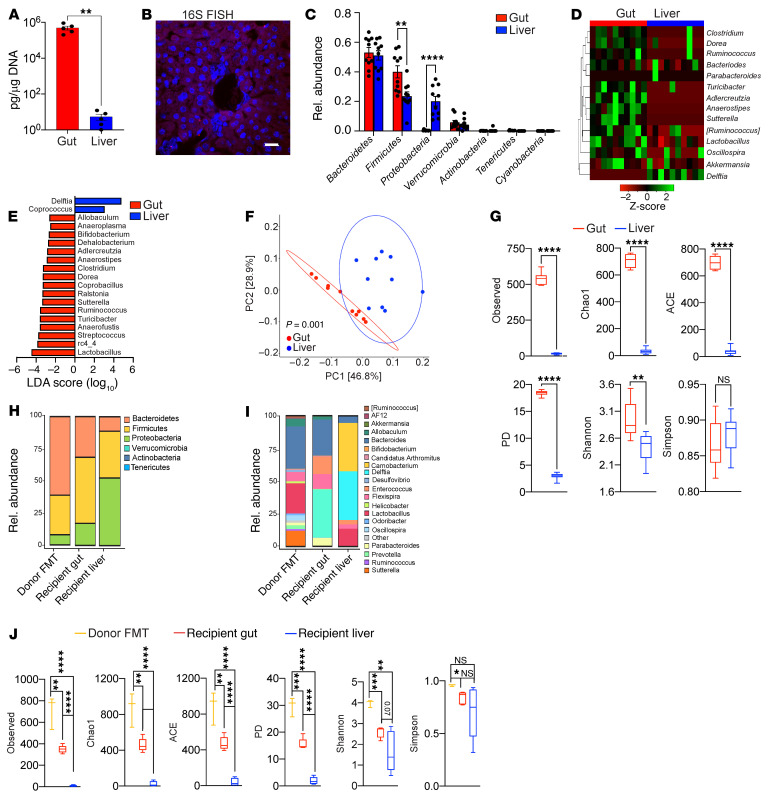
Figure 1. The hepatic microbiome is distinct from that of the gut in mice.
(A) Bacterial DNA content was measured in gut and liver of 6-week-old female WT mice using qPCR. n = 5. **P < 0.01. (B) The presence of an intrahepatic microbiome was evaluated by FISH using a 16S probe. Representative images are shown. Scale bar: 20 μm. (C) Taxonomic composition of microbiota assigned to the phylum level in the gut and liver based on average percentage of relative (Rel.) abundance determined by 16S rRNA-Seq. n = 10. **P < 0.01; ****P < 0.0001. (D) Heatmap showing log2-transformed relative abundance of the most highly represented bacterial genera in liver and gut. (E) Linear discriminant analysis (LEfSe) based on 16S rRNA-Seq identified differentially abundant genera in liver (blue bars) and gut (red bars). (F) Weighted PCoA plots based on Bray-Curtis dissimilarity matrix. Each symbol represents a sample from liver (blue) or gut (red). Clusters were determined by pairwise PERMANOVA. The x and y axes indicate percentage of variation, and ellipses indicate 95% CI. (G) The liver and gut microbiomes in 6-week-old female WT mice were analyzed for α-diversity measures including observed OTUs, Chao1, ACE, PD, and Shannon and Simpson indices. **P < 0.01; ****P < 0.0001. (H–J) Germ-free mice were treated with FMT. Taxonomic composition of microbiota in the donor FMT slurry, recipient liver, and recipient gut were assigned to phylum (H) and genus (I) levels, and α-diversity measures were determined (J) based on 16S rRNA-Seq. n = 5. *P < 0.05; **P < 0.01; ***P < 0.001; ****P < 0.0001.

