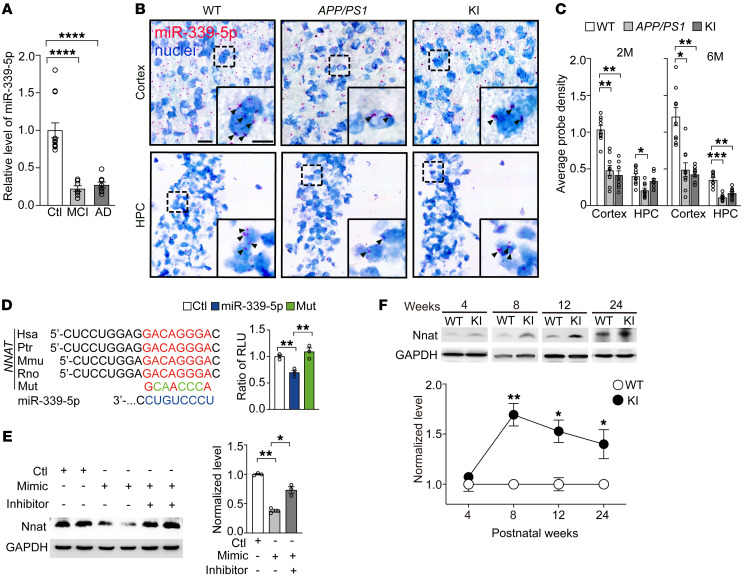
Figure 1. Downregulation of miR-339-5p and elevated Nnat in prodromal AD.
(A) Expression of miR-339-5p in AD (n = 8) and MCI (n = 7) patients’ serum compared with age-matched healthy people (n = 13). (B) Representative images of in situ hybridization staining for miR-339-5p in HPC and cortex on brain slices from 2-month-old WT, APP/PS1, and KI mice. Nuclei (blue) were stained with hematoxylin. Black arrows show miR-339-5p–positive dots. Scale bars: 20 μm (left); 10 μm (right). (C) Quantification of miR-339-5p probe expression in HPC and cortex for 2-month-old (2M) and 6-month-old transgenic mice. n = 9 slices from 3 mice for each group. (D) Left: predicted binding sites of miR-339-5p in Nnat 3′ UTR and its mutation (Mut). Right: relative luciferase activity (relative luciferase units [RLU]) was assayed in SH-SY5Y cells transfected with miR-339-5p or scramble control with WT or mutant 3′ UTR of Nnat. n = 3 independent experiments. (E) Expression levels of Nnat dramatically decreased after treatment with miR-339-5p mimics. n = 3 for each group. (F) Expression of Nnat was elevated in cortex of KI mice (n = 3) compared with age-matched control mice (n = 3). Data are represented as mean ± SEM. *P < 0.05; **P < 0.01; ****P < 0.0001. Unpaired t test (F) and 1-way ANOVA (A, and C–E) were used.

