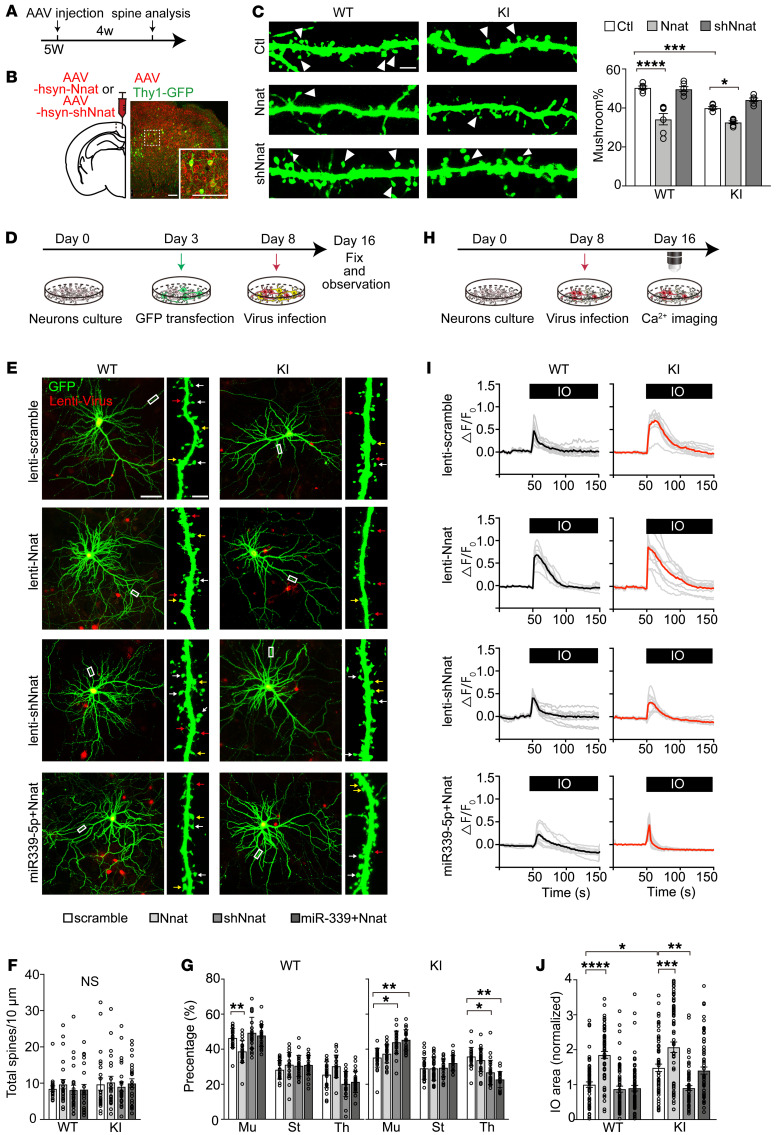
Figure 3. Nnat contributes to neural synaptic and calcium impairments.
(A) AAV injections were given to 5-week-old (5W) mice, and spine analyses were performed after 4 weeks (4w). (B) Left: bilateral injection of AAV into the RSC of Thy1-GFP and M146V; Thy1-GFP mice. Right: representative images of viral expression colocalized with Thy1+ neurons (green). Scale bars: 100 μm. (C) Left: representative images of spine morphology after viral infection. White arrowheads indicate mushroom-type spines. Scale bar: 2 μm. Right: quantitation of the percentage of mushroom-type spines of different groups. n = 6 mice for each group. (D) GFP was transfected on DIV3, and lentivirus was added on DIV8. Neurons were ultimately fixed and observed on DIV16. (E) Representative cultured neuron images and spine fractions. White arrows indicate mushroom-type spines. Yellow arrows indicate stubby type, and red arrows indicate thin type. Scale bars: 50 μm (left); 2 μm (right). (F) Total spine density in cortical neuron cultures; 3 to 5 dendrites per neuron were calculated. n = approximately 20–24 neurons for each group. (G) Percentages of mushroom (Mu), stubby (St), and thin (Th) spines in cortical neurons cultured from WT and KI mice treated with lentivirus. n = approximately 23–32 neurons for each group. (H) Lentivirus was added on DIV8, and calcium imaging was performed on DIV16. (I) Time courses of Fura-2 Ca2+ signals (F340/F380) in the ER of neurons. Individual cell trace (gray) and average trace (black for WT and red for KI) are shown for each group. (J) Quantification for average sizes of IO-induced Ca2+ estimated as AUC of Fura-2 signal in each group (normalized to control group). n = approximately 60–79 neurons for each group. All neurons were analyzed from 3 batches of cultures. Data are represented as mean ± SEM. *P < 0.05; **P < 0.01; ***P < 0.001; ****P < 0.0001, 2-way ANOVA.

