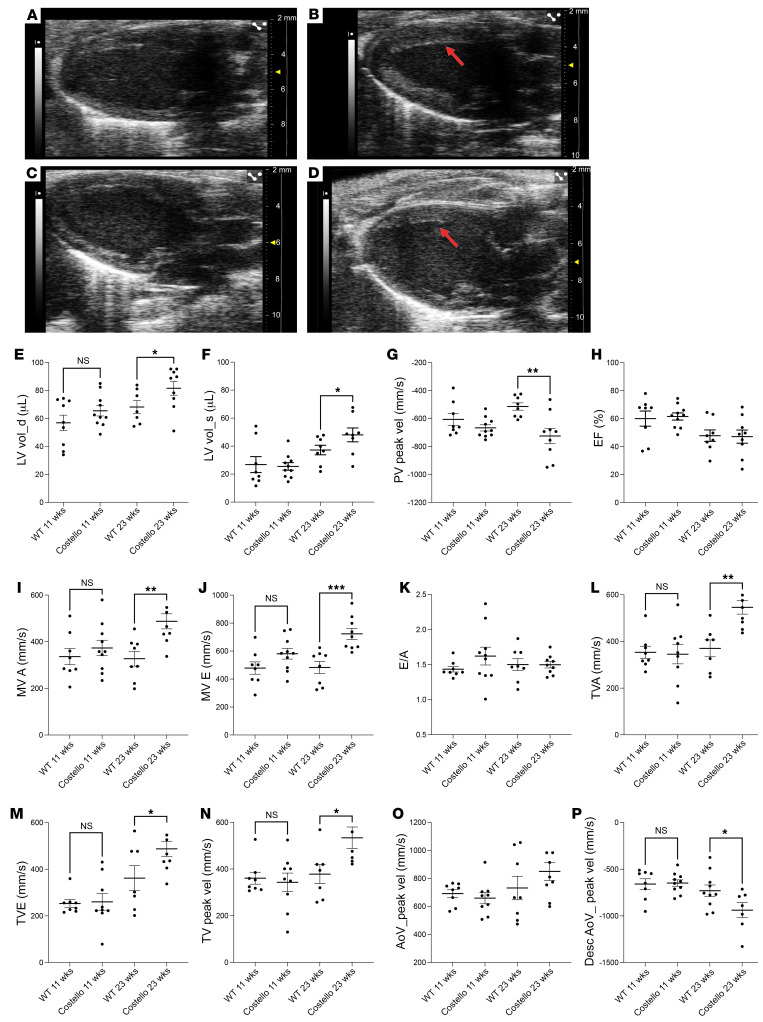
Figure 1. Hypertrophic cardiomyopathy in patients with CS and the mouse model.
Parasternal echography was performed in (A and C) WT (HRAS) or (B and D) Costello (HRAS p.G12S) mice at 11 weeks (A and B) and 23 weeks (C and D) of age. Left ventricle hypertrophy is indicated by arrows. (E) Left ventricle volume at diastole (LV vol_d), (F) left ventricle volume at systole (LV vol_s), (G) pulmonary valve peak velocity (PV peak vel), (H) ejection fraction (EF), (I) mitral valve flow A wave maximal velocity (MV A), (J) mitral valve flow E wave maximal velocity (MV E), (K) E/A ratio, (L) tricuspid valve flow A wave maximal velocity (TVA), (M) tricuspid valve flow E wave maximal velocity (TVE), (N) tricuspid valve peak velocity (TV peak vel), (O) aorta peak velocity (AoV_peak vel), and (P) descending aorta peak velocity (Desc AoV_peak vel). The data are expressed as the mean ± SEM. *P < 0.05, **P < 0.01, ***P < 0.001 (unpaired t test was performed between the CS mouse group and the corresponding age-matched WT animals). HCM, hypertrophic cardiomyopathy.

