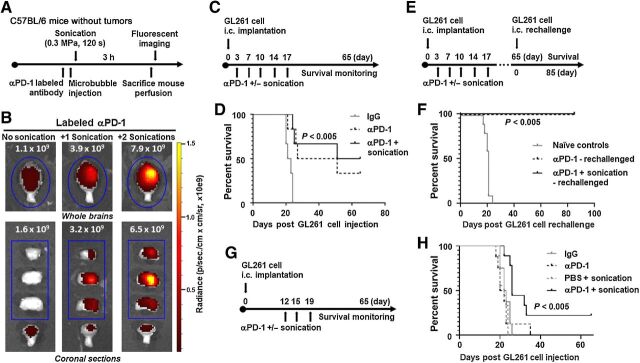
Figure 2.
Anti–PD-1 administered with ultrasound BBBD caused increased delivery of the antibody to the brain and enhanced survival in glioma-bearing mice. A, Schema for treatment with labeled anti–PD-1 administered with ultrasound in non–tumor-bearing C57BL/6 mice. B, Fluorescent images of whole and coronally sectioned brains performed immediately after perfusion and brain dissection following the treatment described in A. Mice were treated with the labeled anti–PD-1 antibody alone (left), labeled anti–PD-1 and one sonication (middle), or labeled anti–PD-1 and two sonications (right). C, The treatment schema of GL261 tumor–bearing mice treated with anti–PD-1 with or without LIPU. D, Kaplan–Meier survival analysis of C57BL/6 mice treated with IgG (control), anti–PD-1, or anti–PD-1 with ultrasound (six mice per group). PBS with sonication control for the GL261 model is demonstrated in Supplementary Fig. S1A. Survival analysis was performed using the log-rank (Mantel–Cox) test. The MS durations in the treatment groups were as follows: IgG, 22 days; anti–PD-1, 39 days; anti–PD-1 with ultrasound, 58 days. Statistics: IgG versus anti–PD-1, P = 0.007; IgG versus anti–PD-1 with ultrasound, P = 0.0022; and anti–PD-1 versus anti–PD-1 with ultrasound, P = 0.6226. This experiment was repeated with similar findings. E, Treatment schema for long-term survivors and naïve age-matched controls which were rechallenged in the contralateral hemisphere. F, Kaplan–Meier survival analysis of long-term survivors in E. The MS durations in the treatment groups were as follows: naïve controls (10 mice), 21 days; anti–PD-1 (2 mice), undefined; anti–PD-1 with ultrasound (3 mice), undefined. Statistics: naïve control versus anti–PD-1, P = 0.0148; naïve control versus anti–PD-1 with ultrasound, P = 0.0044. G, The treatment schema of GL261 tumor–bearing mice treated with anti–PD-1 with or without LIPU at a later time point when tumors are well established. H, Kaplan–Meier survival analysis of C57BL/6 mice treated with IgG (control), anti–PD-1, PBS with ultrasound, or anti–PD-1 with ultrasound (8–9 mice per group). Survival analysis was performed using the log-rank (Mantel–Cox) test. The MS durations in the treatment groups were as follows: IgG, 22.5 days; anti–PD-1, 22 days; PBS with ultrasound, 21 days; anti–PD-1 with ultrasound, 26 days. Statistics: IgG versus anti–PD-1, P = 0.6186; IgG versus PBS with ultrasound, P = 0.1947; IgG versus anti–PD-1 with ultrasound, P = 0.0032; anti–PD-1 versus PBS with ultrasound, P = 0.7483; anti–PD-1 versus anti–PD-1 with ultrasound, P = 0.0164; and PBS with ultrasound versus anti–PD-1 with ultrasound, P = 0.0002.

