. 2021 May 24;27(15):4325–4337. doi: 10.1158/1078-0432.CCR-20-3760

Figure 5.

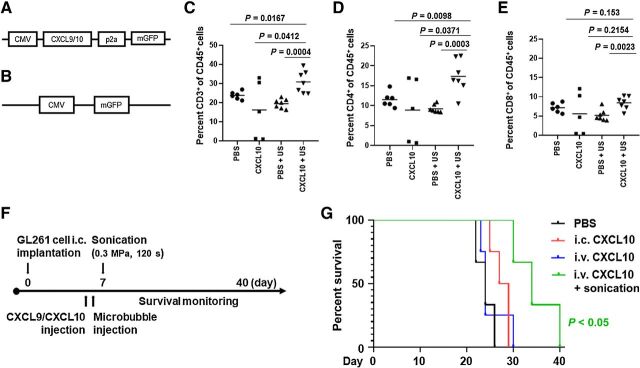
Figure 5. APCs expressing CXCL10 administered intravenously with LIPU-induced BBBD were associated with a significant increase in immunocompetent mouse survival durations. A, Schema of the lentivirus gene transfer plasmid structure for murine CXCL9 or CXCL10. B, Gene transfer plasmid of control methionine-deficient green fluorescent protein alone. C, Flow cytometry analysis of the percentage of CD3+ T cells within the total CD45+ immune cell infiltration within intracerebral gliomas in the different treatment groups (n = 5–7/group). Statistics: PBS versus CXCL10 with ultrasound, P = 0.0167; CXCL10 versus CXCL10 with ultrasound, P = 0.0412; PBS with ultrasound versus CXCL10 with ultrasound, P = 0.0004. D, Flow cytometry analysis of CD4+ T cells within the total CD45+ immune cell infiltration within intracerebral gliomas. Statistics: PBS versus CXCL10 with ultrasound, P = 0.0098; CXCL10 versus CXCL10 with ultrasound, P = 0.0371; PBS with ultrasound versus CXCL10 with ultrasound, P = 0.0003. E, Flow cytometry analysis of CD8+ T cells within the total CD45+ immune cell infiltration within intracerebral gliomas. Statistics: PBS with ultrasound versus CXCL10 with ultrasound, P = 0.0023; PBS versus CXCL10 with ultrasound, P = 0.153; CXCL10 versus CXCL10 with ultrasound, P = 0.2154, as assessed by the two-sided unpaired t test. F, Treatment schema for C57BL/6 mice bearing GL261 tumors treated with CXCL9 or CXCL10 APCs. G, Kaplan–Meier survival analysis of mice treated with PBS, i.c. CXCL10 APCs, i.v. CXCL10 APCs, or i.v. CXCL10 APCs with ultrasound. PBS with sonication control for the GL261 model is demonstrated in Supplementary Fig. S1A. The MS durations in the treatment groups were as follows: PBS (3 mice), 24 days; i.c. CXCL10 APCs (4 mice), 28 days; i.v. CXCL10 APCs (4 mice), 24 days; i.v. CXCL10 APCs with ultrasound (3 mice), 34 days. Statistics: PBS versus i.c. CXCL10 APCs, P = 0.0476; PBS versus i.v. CXCL10 APCs, P = 0.6041; PBS versus i.v. CXCL10 APCs with ultrasound, P = 0.0246; i.c. CXCL10 APCs versus i.v. CXCL10 APCs, P = 0.6349; i.c. CXCL10 APCs versus i.v. CXCL10 APCs with ultrasound, P = 0.0213; i.v. CXCL10 APCs versus i.v. CXCL10 APCs with ultrasound, P = 0.0415.

APCs expressing CXCL10 administered intravenously with LIPU-induced BBBD were associated with a significant increase in immunocompetent mouse survival durations. A, Schema of the lentivirus gene transfer plasmid structure for murine CXCL9 or CXCL10. B, Gene transfer plasmid of control methionine-deficient green fluorescent protein alone. C, Flow cytometry analysis of the percentage of CD3+ T cells within the total CD45+ immune cell infiltration within intracerebral gliomas in the different treatment groups (n = 5–7/group). Statistics: PBS versus CXCL10 with ultrasound, P = 0.0167; CXCL10 versus CXCL10 with ultrasound, P = 0.0412; PBS with ultrasound versus CXCL10 with ultrasound, P = 0.0004. D, Flow cytometry analysis of CD4+ T cells within the total CD45+ immune cell infiltration within intracerebral gliomas. Statistics: PBS versus CXCL10 with ultrasound, P = 0.0098; CXCL10 versus CXCL10 with ultrasound, P = 0.0371; PBS with ultrasound versus CXCL10 with ultrasound, P = 0.0003. E, Flow cytometry analysis of CD8+ T cells within the total CD45+ immune cell infiltration within intracerebral gliomas. Statistics: PBS with ultrasound versus CXCL10 with ultrasound, P = 0.0023; PBS versus CXCL10 with ultrasound, P = 0.153; CXCL10 versus CXCL10 with ultrasound, P = 0.2154, as assessed by the two-sided unpaired t test. F, Treatment schema for C57BL/6 mice bearing GL261 tumors treated with CXCL9 or CXCL10 APCs. G, Kaplan–Meier survival analysis of mice treated with PBS, i.c. CXCL10 APCs, i.v. CXCL10 APCs, or i.v. CXCL10 APCs with ultrasound. PBS with sonication control for the GL261 model is demonstrated in Supplementary Fig. S1A. The MS durations in the treatment groups were as follows: PBS (3 mice), 24 days; i.c. CXCL10 APCs (4 mice), 28 days; i.v. CXCL10 APCs (4 mice), 24 days; i.v. CXCL10 APCs with ultrasound (3 mice), 34 days. Statistics: PBS versus i.c. CXCL10 APCs, P = 0.0476; PBS versus i.v. CXCL10 APCs, P = 0.6041; PBS versus i.v. CXCL10 APCs with ultrasound, P = 0.0246; i.c. CXCL10 APCs versus i.v. CXCL10 APCs, P = 0.6349; i.c. CXCL10 APCs versus i.v. CXCL10 APCs with ultrasound, P = 0.0213; i.v. CXCL10 APCs versus i.v. CXCL10 APCs with ultrasound, P = 0.0415.