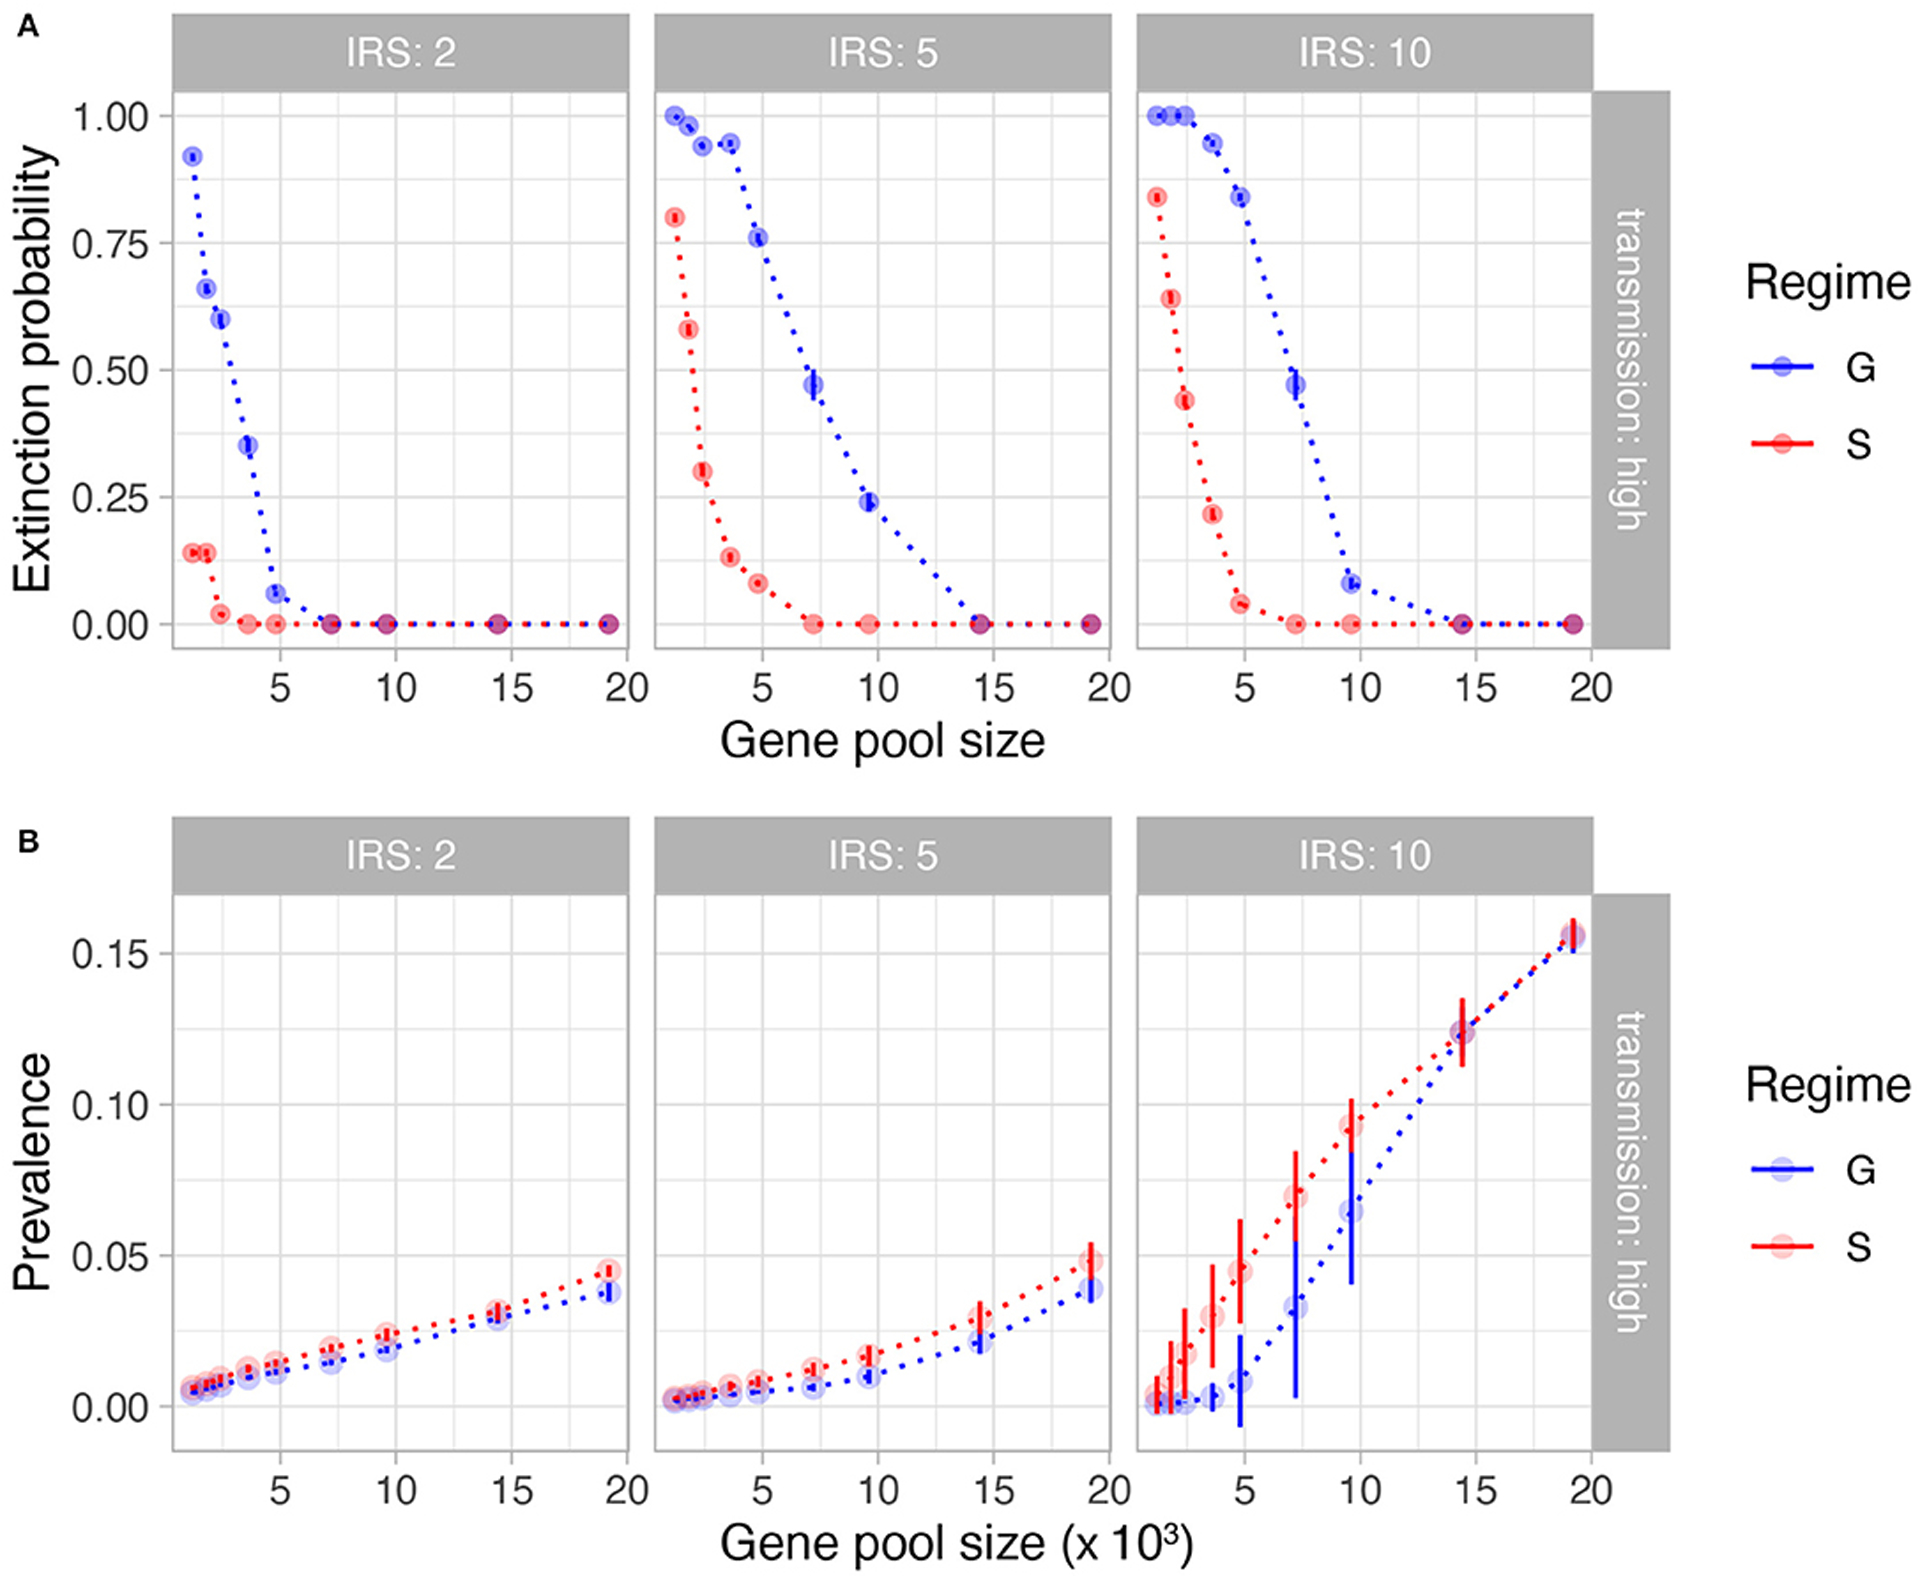
FIGURE 2 |.

Extinction probability (A) and mean prevalence during IRS (B) as a function of initial gene pool size and lengths of IRS (columns). Shown here are the results from high transmission intensities. See Supplementary Figure 1 for results from low and medium transmission intensities. In (A), each point is the proportion of simulation runs for the given parameter combination (out of 50 runs) that crashed before the IRS was lifted. In (B), each point represents the mean value (bars represent standard deviation) of prevalence for those simulation runs that survived the IRS for the given parameter combination. Blue and red colors depict generalized immunity (G, the neutral model) and specific immunity (S, NFDS), respectively. It is clear that despite comparable prevalence, the parasite population is more persistent in the immune selection scenario.
