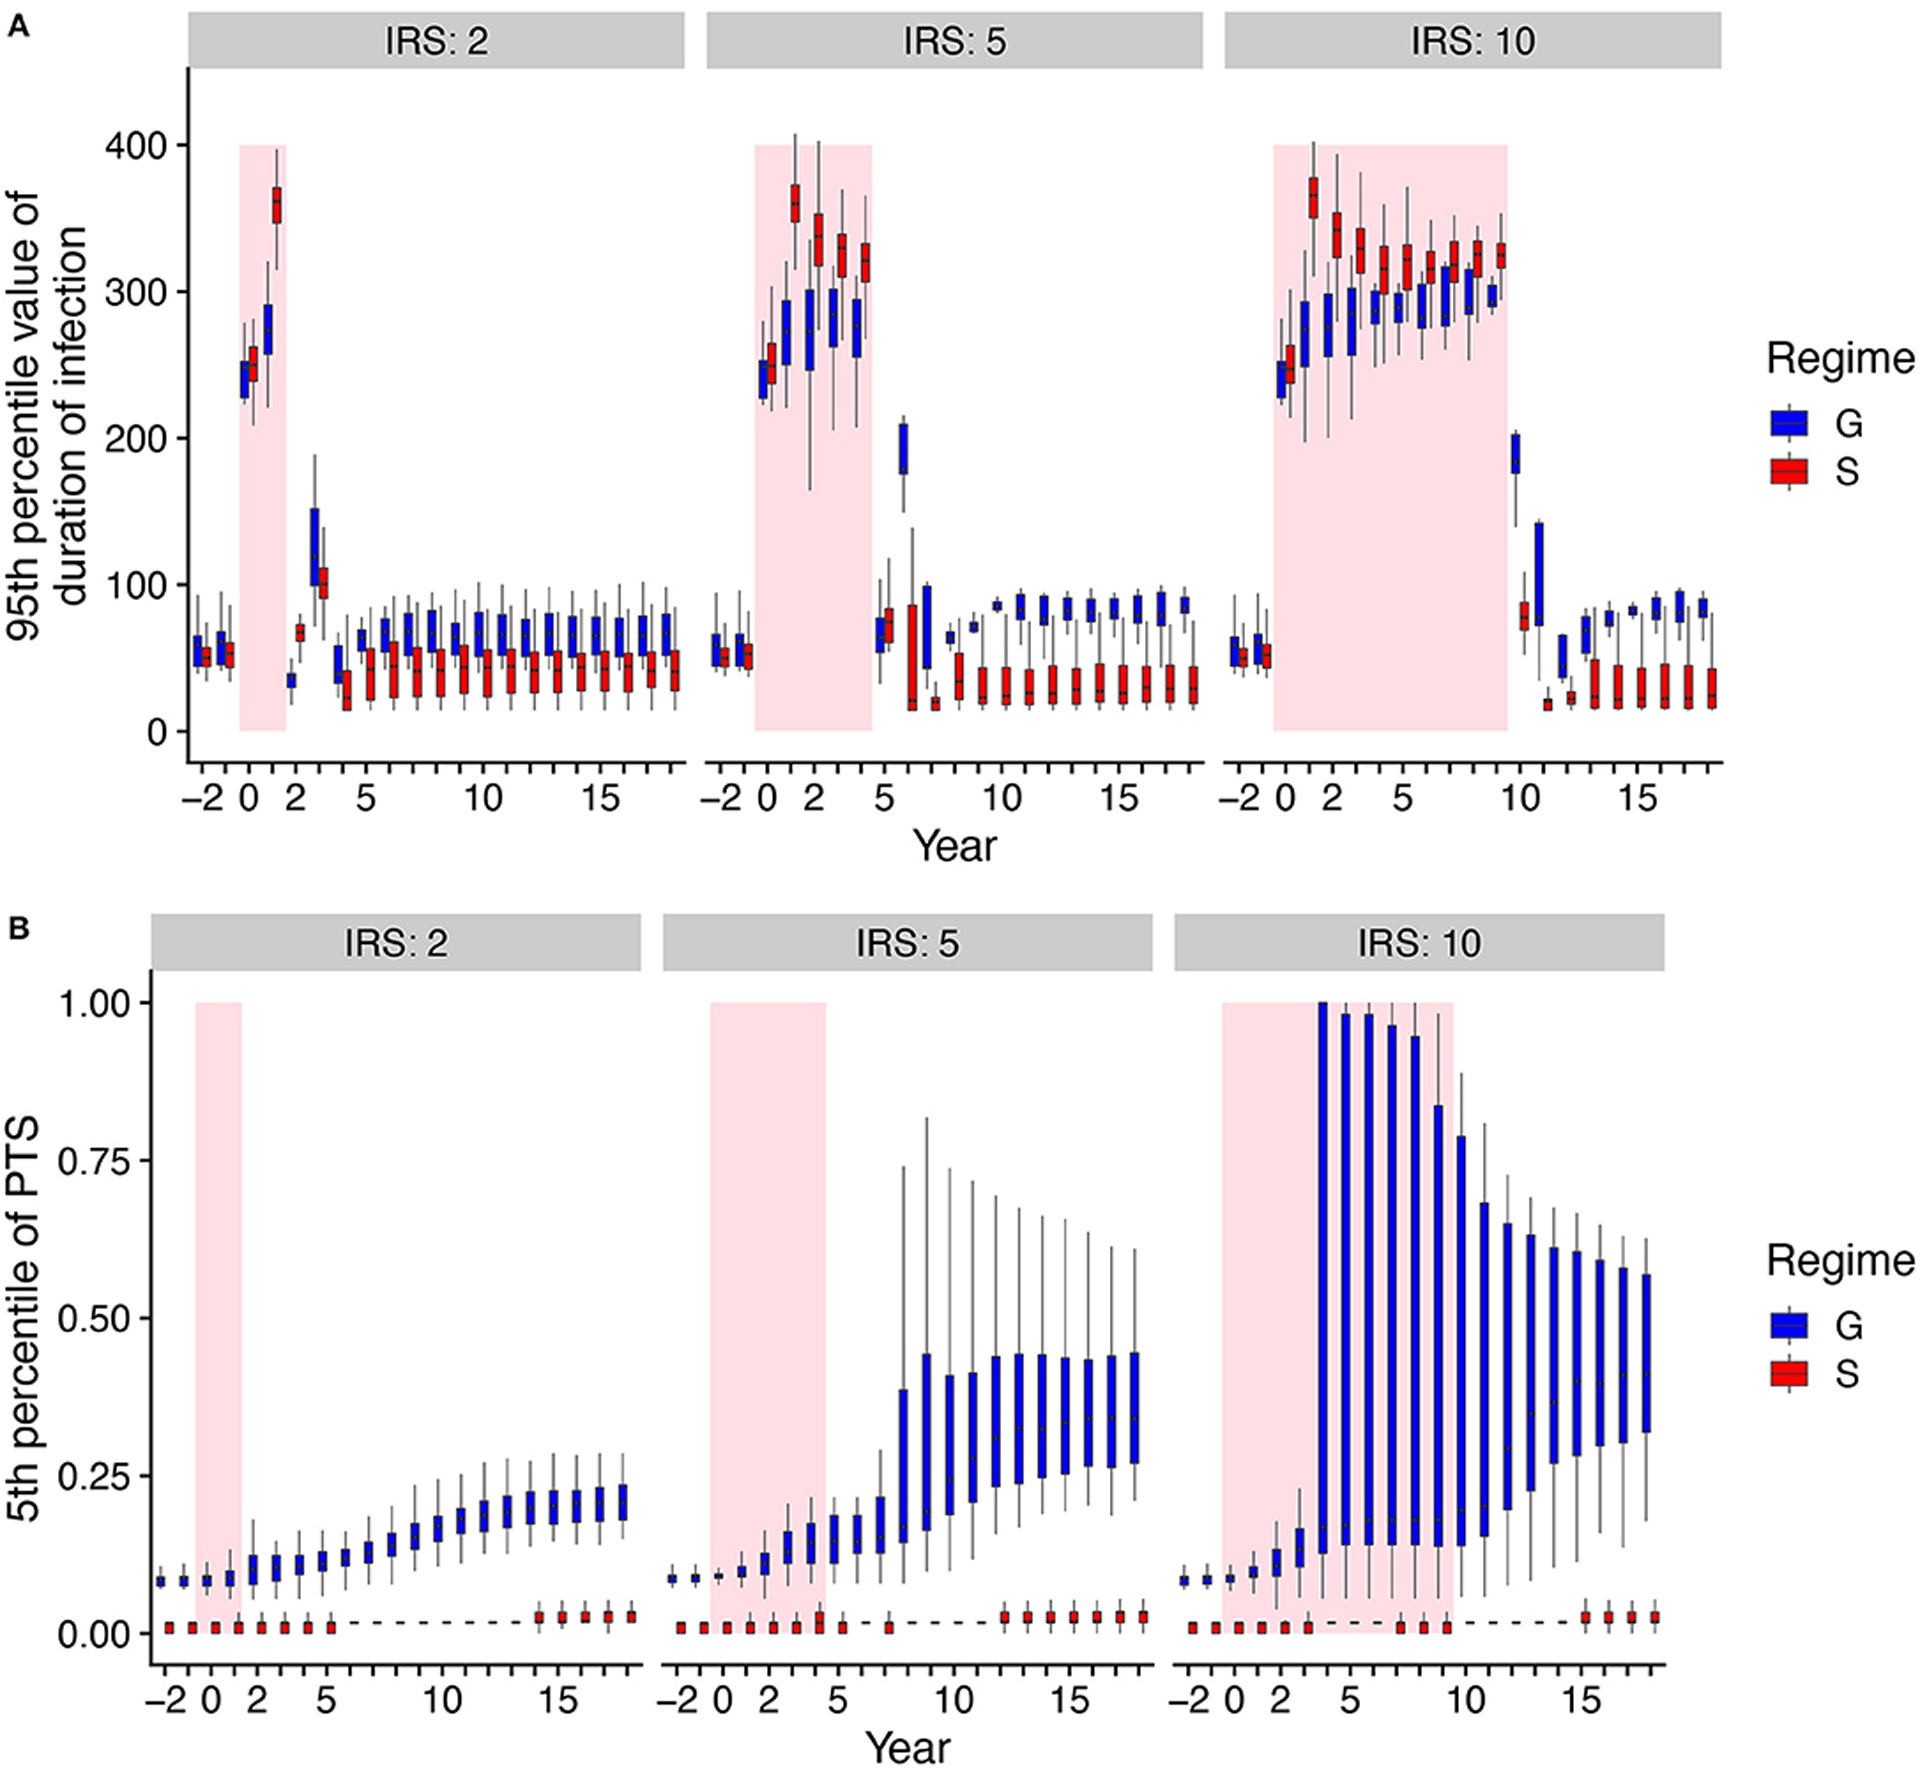
FIGURE 3 |.

Comparisons of duration of infection and mean PTS over time under high transmission between the two regimes with and without NFDS. Boxplots summarize the distribution among replication runs of the 95th percentile of duration of infection (A), and the distribution of the 5th percentile of PTS between var repertoires (B). We therefore focus on the longest periods of infection duration and correspondingly, the most dissimilar parasites. Shaded areas indicate the intervention (IRS) period. Negative years correspond to times prior to IRS.
