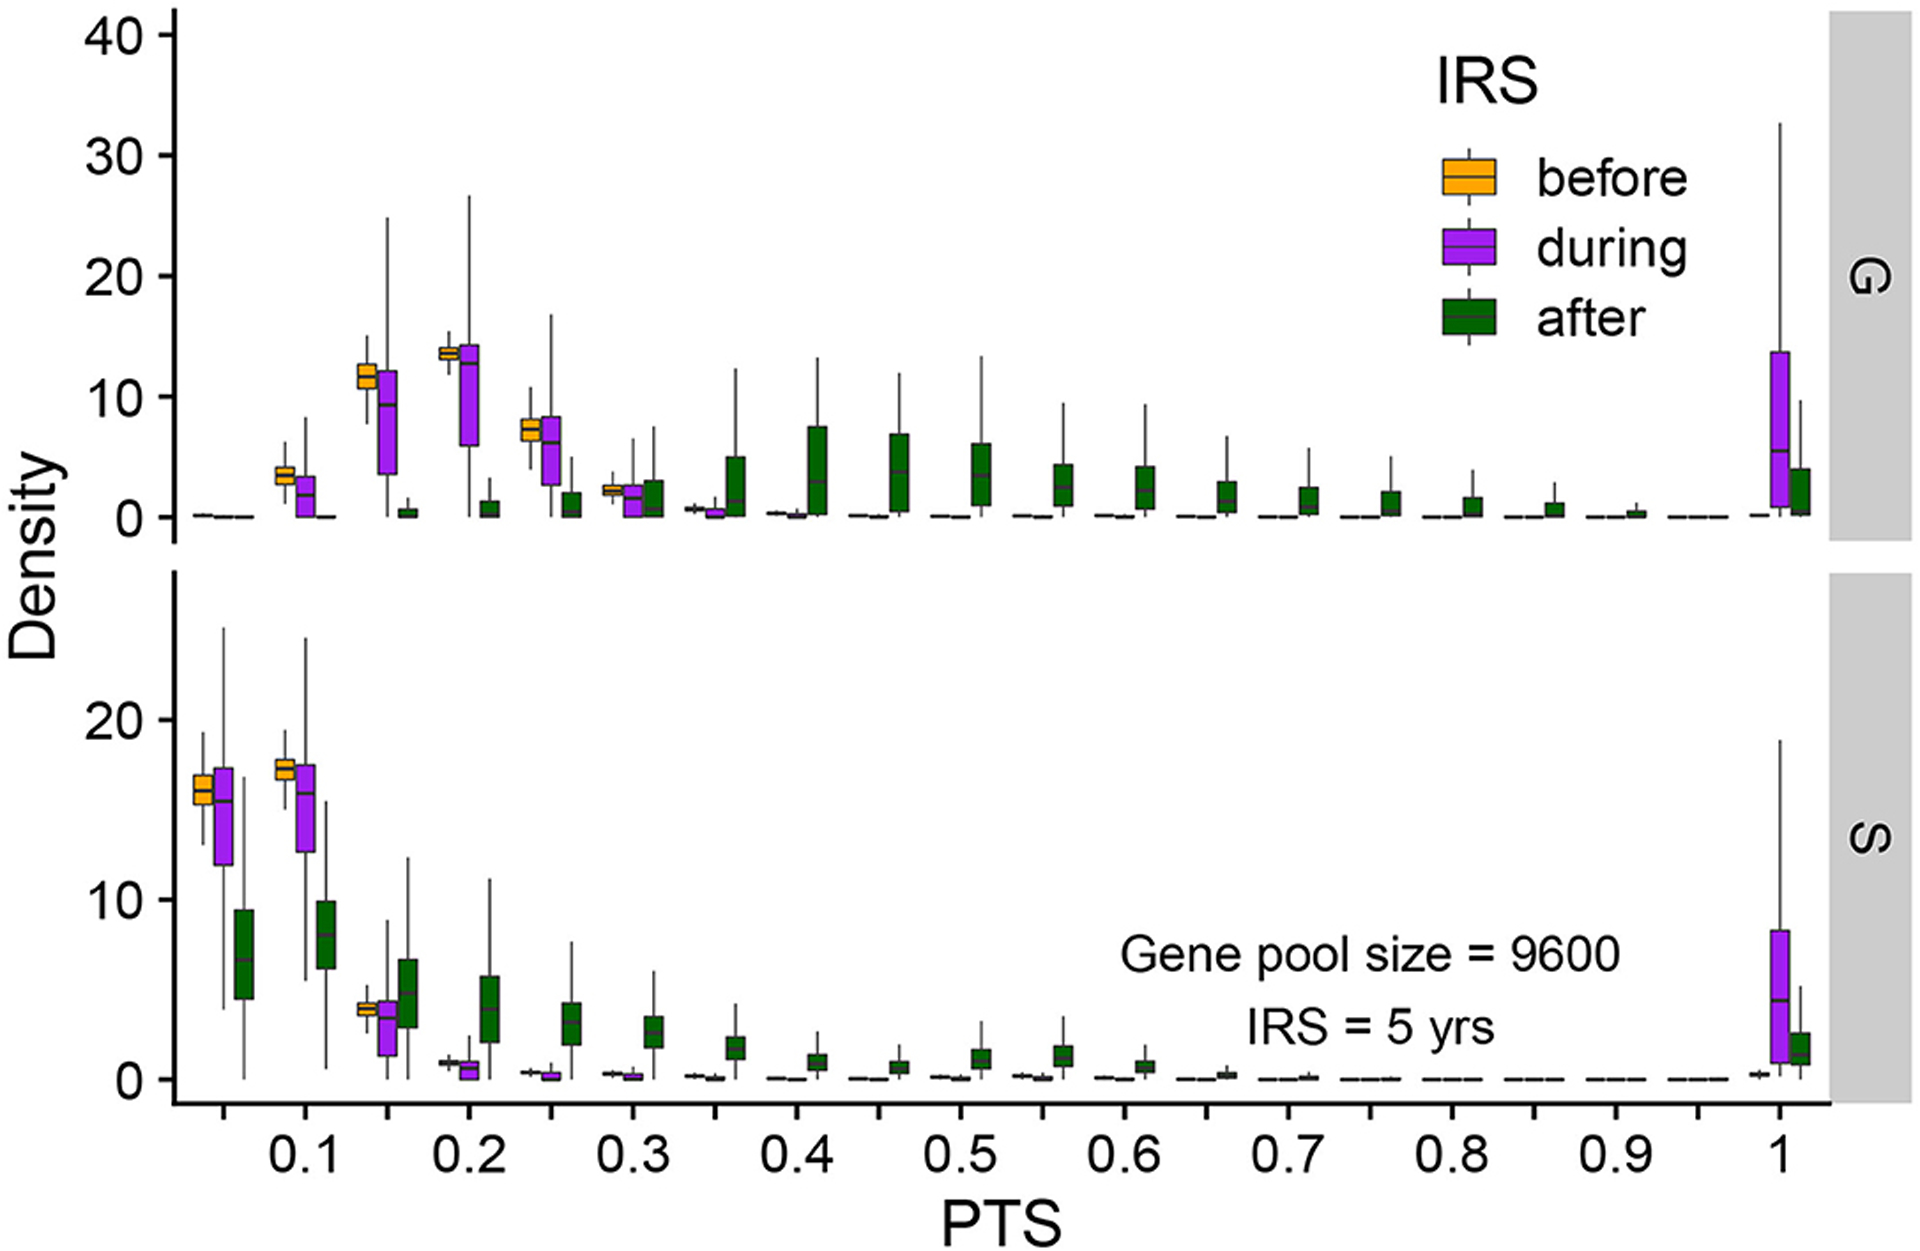
FIGURE 4 |.

Distribution of pairwise PTS for var repertoires before (orange), during (purple), and after (green) intervention under S and G. PTS values are binned into 40 equally-sized bins (of 0.05). Each box shows the variation of PTS values across different runs. Summarized here are runs from a gene pool size of 9,600, high transmission and a 5-year intervention. The PTS distributions differ between G and S. After intervention, the PTS distribution in G drifts away from its initial state, whereas that in S tends to go back to its pre-IRS state.
