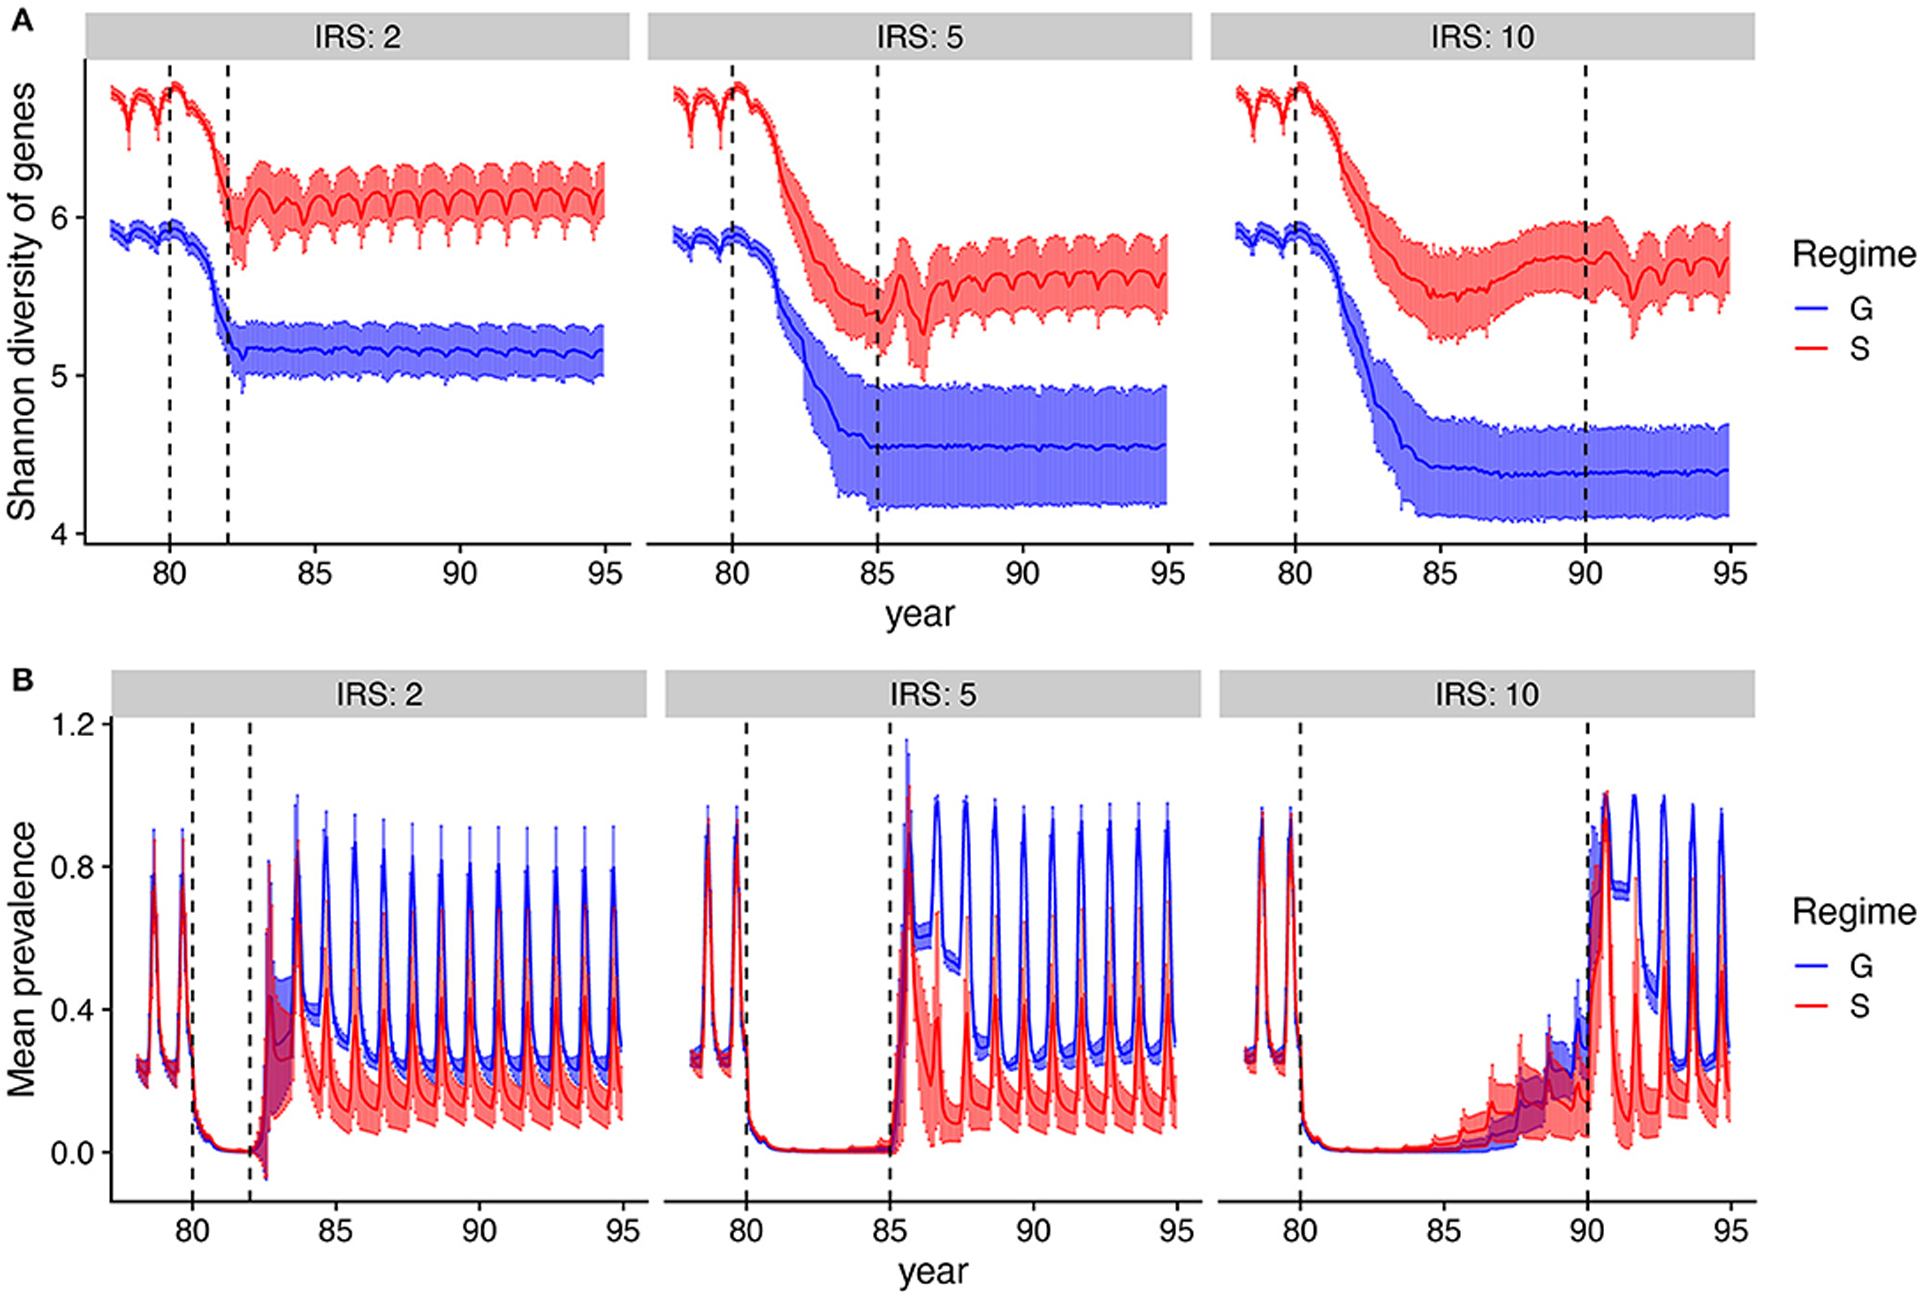
FIGURE 5 |.

Dynamics of genetic diversity and prevalence during and after IRS. (A) Mean Shannon diversity (solid line) and standard deviation (error bars) of var gene types are tracked over time. Shaded areas show the extent of the variation across runs. (B) Mean changes in prevalence (solid line) and its variation (error bars) over time. After IRS, prevalence returns back to pre-IRS stage under generalized immunity (G), whereas it gravitates to a lower level under specific immunity (S). Parameters: gene pool size equals 9,600 and transmission rate is high. Only runs that persisted after IRS are included.
