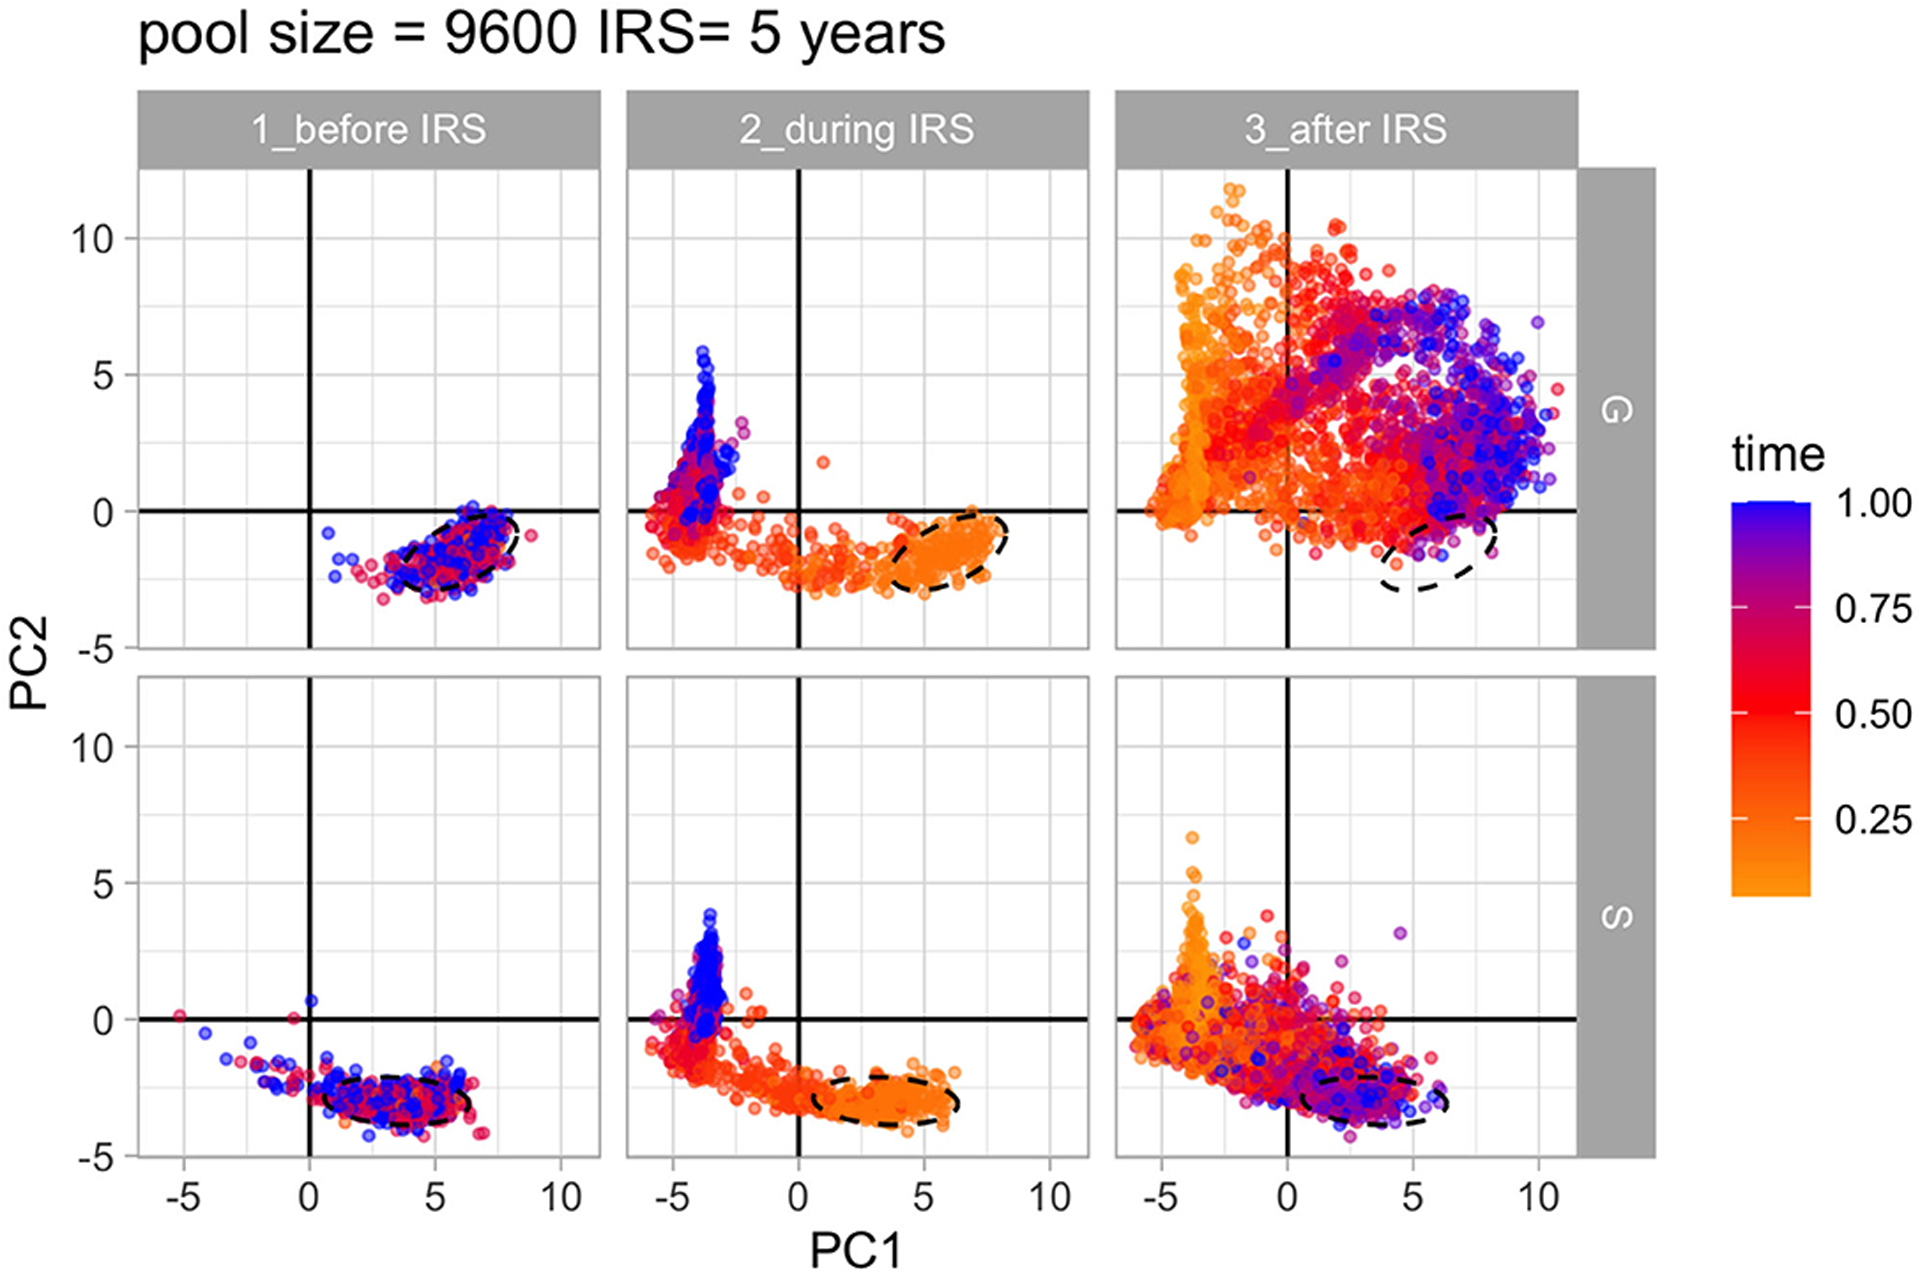
FIGURE 6 |.

Principal component analysis of 37 network properties of var repertoire similarity networks. PCA over time shows how the structure of diversity changes in the 2D space of the PCs for S and G under high transmission. The colors of the networks represent their relative time within the specific time period (i.e., before, during and after IRS) in the simulation. Ellipses show the location of network properties for pre-IRS layers. Parameters: gene pool size equals 9,600 and IRS lasts for 5 years.
