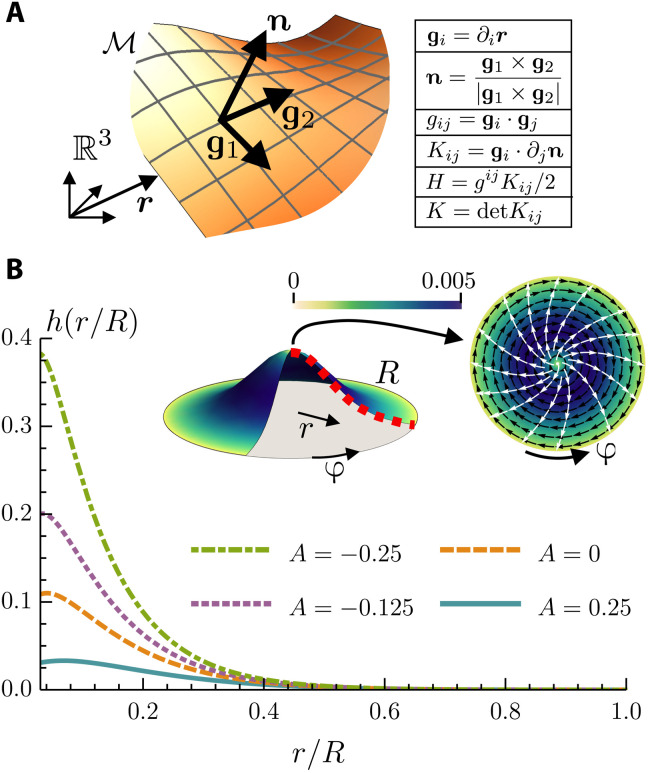
Fig. 2. Post-buckling geometry of layer.
(A) Sketch of the midsurface ℳ embedded in ℝ3. In the table, the cross and the dot refer to the vector and scalar product, respectively, with respect to the Euclidean metric of ℝ3. In the figure and throughout the article, bold letters indicate ℝ3 vectors, and Latin indices indicate surface coordinates on ℳ. The coordinate system on ℳ is denoted by {g, n}, and it defines the metric gij and the curvature tensor Kij of the surface, hence the mean curvature H and Gaussian curvature K. (B) In the top middle, a sketch of the buckled surface with a +1 defect at the center. The disk on the top right is a view from the top. The black arrows are the azimuthal velocity field, the color scale is its magnitude, and the white arrows are the director field. In addition, we solved Eqs. 2 and 3 numerically to plot the height profile h(r/R) of the surface for different values of the active number . Comparing the active with the passive (A = 0) case, we see how an extensile activity (A < 0) favors the buckling, while a contractile one activity inhibits it. The values of the constants used are the following: γ = 0.012, Γ = 1, λ = 1.1, κF = 0.02, κB = 0.01, and η = 5/3.

