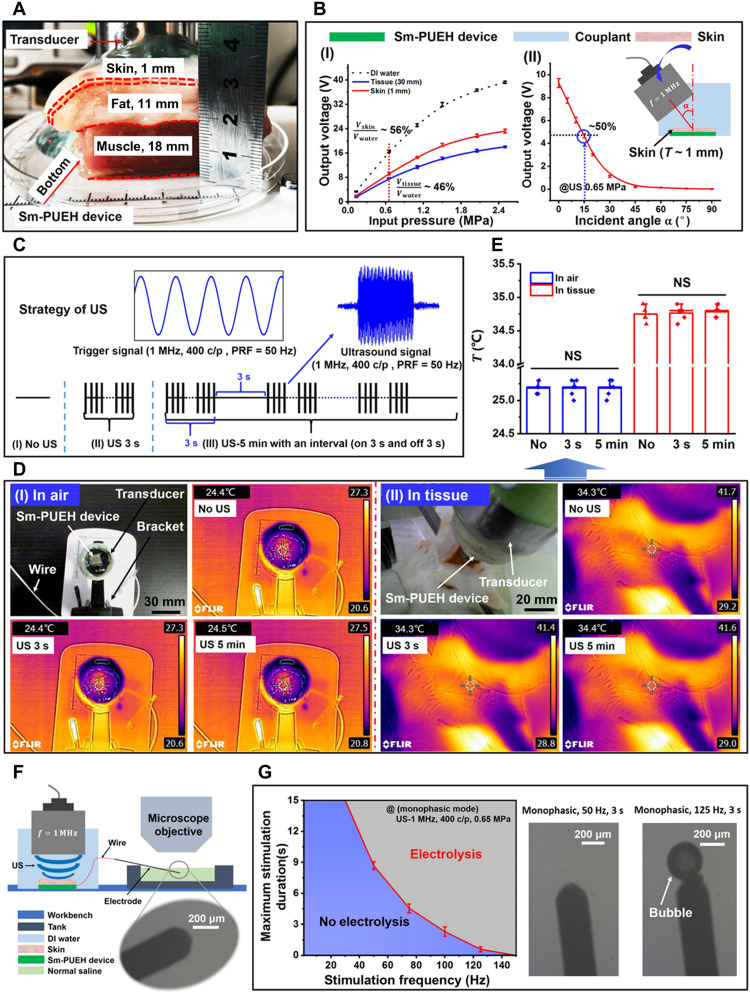
Fig. 3. Output characteristics in tissue of Sm-PUEH device.
(A) Schematic diagram of experimental testing of the device in pork tissue. (B) The output voltage of the device in pork with a thickness of 30 mm driven by the pulse US of different intensities (I) and the output characteristics of the device covered with 1-mm-thick skin by applying different US incident angles (II). (C) Schematic diagram of the strategy for applying US: (I) No US, no US is applied; (II) US 3 s, 1-MHz US [US-400 c/p, pulse repetition frequency (PRF) = 50 Hz, 0.65 MPa] irradiating for 3 s; (III) US 5 min, 1 MHz US (US-400 c/p, PRF = 50 Hz, 0.65 MPa) irradiating for 5 min with an interval (on 3 s and off 3 s). (D) The device’s temperature change in the air and the tissue. (E) The comparison of temperature change for the three groups. NS, not significant. (F) Schematic diagram of electrolysis experiment of Sm-PUEH device. (G) Maximum stimulation duration for Sm-PUEH device in monophasic operation determined by time of electrolysis on an electrode in normal saline, as evidenced by gas bubbles (n = 4).

