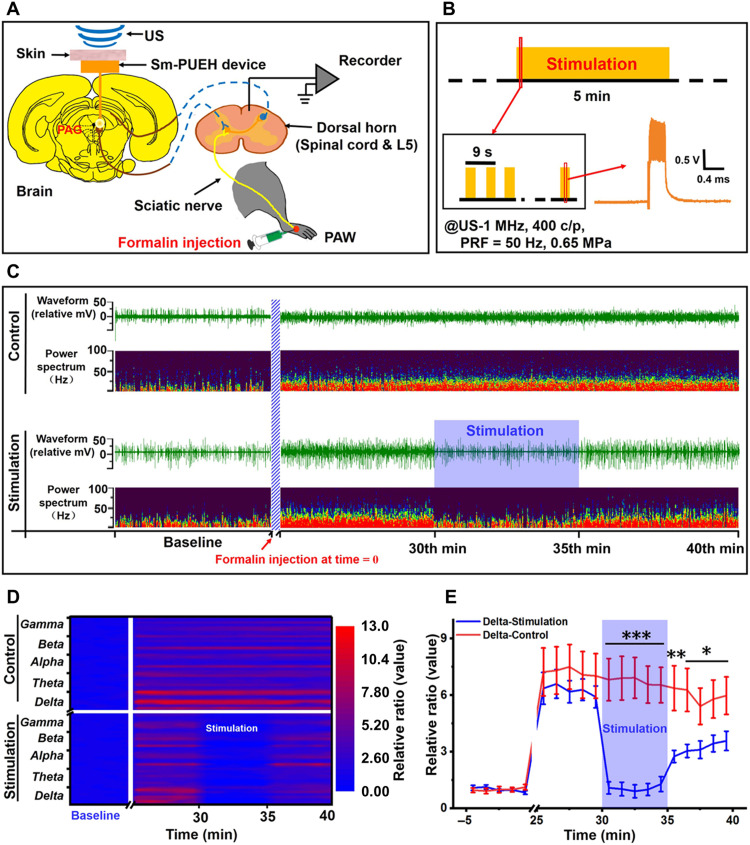
Fig. 5. Inhibition of LFP activity of spinal cord dorsal horn by Sm-PUEH device’s PAG stimulation.
(A) Schematic diagram of the experimental design. Three-percent formalin (50 μl) is injected into the left hindpaw, and US is then applied to trigger the PAG stimulation by the Sm-PUEH device. Electrophysiological signals of the spinal cord dorsal horn (L5) are recorded. (B) Schematic diagram of stimulation strategy with US (US-400 c/p, PRF = 50 Hz, 0.65 MPa) for 5 min with an interval (on 3 s and off 3 s). (C) Representative example of LFP activities from the spinal cord dorsal horn (L5) between the control group (top) and the stimulation group (bottom). In each group, the first row represents the raw trace (waveform), and the second row demonstrates power spectrum. Formalin is injected at time = 0. (D) Heatmap comparison of the power spectrum ratio (calculated by baseline) between the control group and the stimulation group. The power spectrum is broken down into delta (0 to 3 Hz) wave, theta (4 to 7 Hz) wave, alpha (8 to 12 Hz) wave, beta (13 to 30 Hz) wave, and gamma (31 to 100 Hz) wave. (E) The comparison of power spectrum changes in delta (0 to 3 Hz) wave between the control group (n = 8) and the stimulation group (n = 8). The power spectrum is calculated by the average of each minute, and ratio (y axis) is processed by the average baseline of the first 5 min. All data are presented as means ± SEM. *P < 0.05, **P < 0.01, and ***P < 0.001 versus control group.

