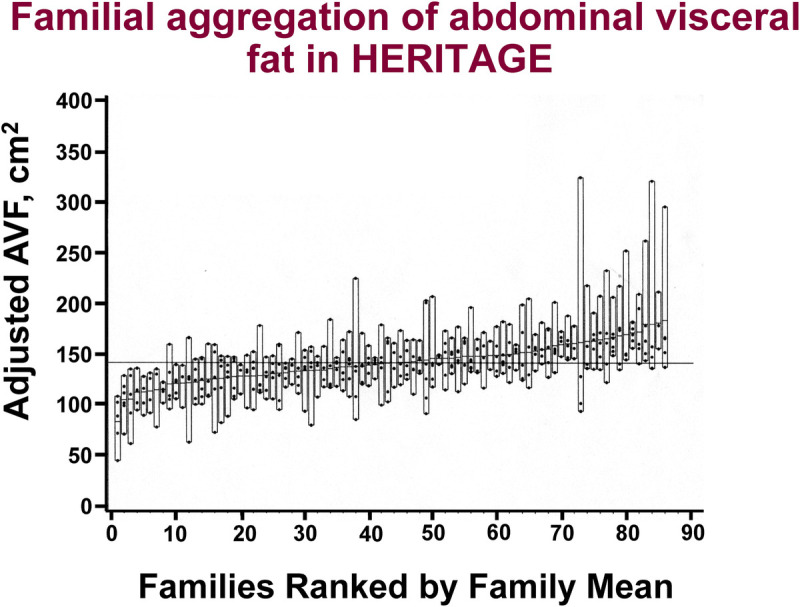
FIGURE 2.

CT measured AVF level at baseline adjusted for age, sex, and FM plotted by family rank among the families of European descent in HERITAGE. Dots within each bar represent individual values for each member of the given family. The dash within each bar is the mean AVF level of each family. For a given level of total adiposity, some families exhibit a mean adjusted AVF level of about 70 to 90 cm2, whereas others have AVF levels in the range of 120 to 150 cm2. Families are ranked by the mean-adjusted AVF level. A strong familial aggregation is observed with a heritability estimate of 47%. Adapted with permission from Rice et al. (32).
