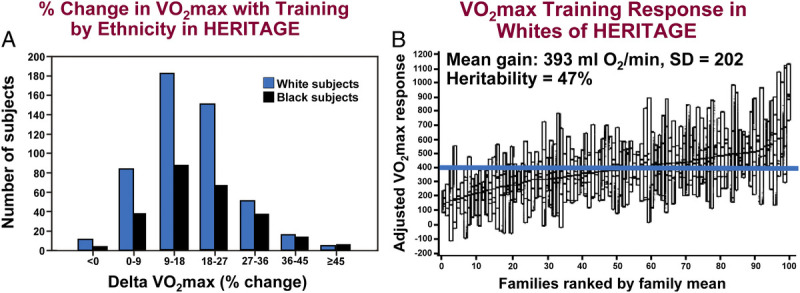
FIGURE 4.

A, Distribution of the gains in V̇O2max expressed as a percentage of baseline V̇O2max level in the samples of Blacks and Whites. B, Familial aggregation of the age and sex adjusted V̇O2max changes with the exercise program in the sample of Whites of European descent. Families are ordered by the mean gain for all family members. The F ratio from the ANOVA shows that there are 2.5 times more variance between families than within families (P = 0.0001). The horizontal blue line represents the mean gain for the whole group. The heritability of the V̇O2max training response reached 47%. Adapted with permission from Bouchard et al. (41).
