FIGURE 2.
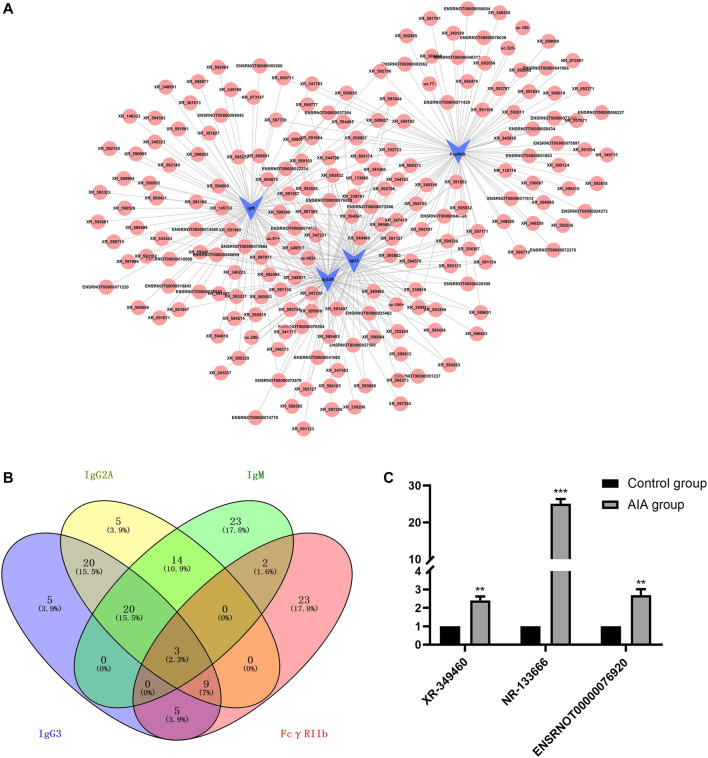
lncRNA-mRNA co-expression networks and real-time quantitative PCR validation. (A) Four verified co-expression networks of mRNAs and their associated lncRNAs. The blue dots represent mRNAs and red dots represent their correlated lncRNAs. There were 309 positive interactions (linked with continuous lines) and 66 negative interactions (linked with dotted lines). The absolute value of correlation coefficients of all the directly linked pairs exceeded 0.990. (B) Venn diagram illustrating the intersections of lncRNAs with Pearson correlation coefficients equal to or higher than 0.992, using 4-way Venn Diagram Generator. The common intersection result is upregulated lncRNA XR-349460, NR-133666 and ENSRNOT00000076920. (C) The qRT-PCR validation of the three selected lncRNA. Results were similar to that of lncRNA microarray.

