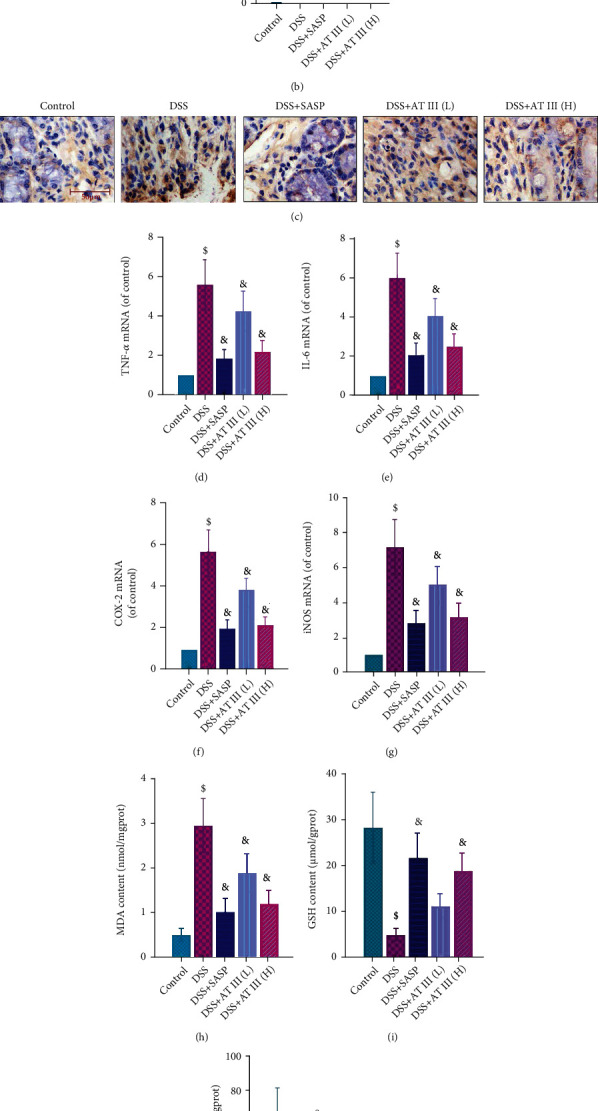
Figure 2.

AT III ameliorates DSS-induced inflammation and oxidative stress. (a, b) H&E staining of colon tissues and quantification of histological scores. Scale bar: 200 μm. (c) Immunohistochemical detection of MPO in colons. Scale bar: 50 μm. (d–g) qPCR results of TNF-α, IL-6, COX-2, and iNOS mRNA in colons. (h–j) ELISA measurements of MDA and GSH content, as well as SOD activity. $p < 0.05, compared to control; &p < 0.05, compared to DSS.
