
Figure 2.
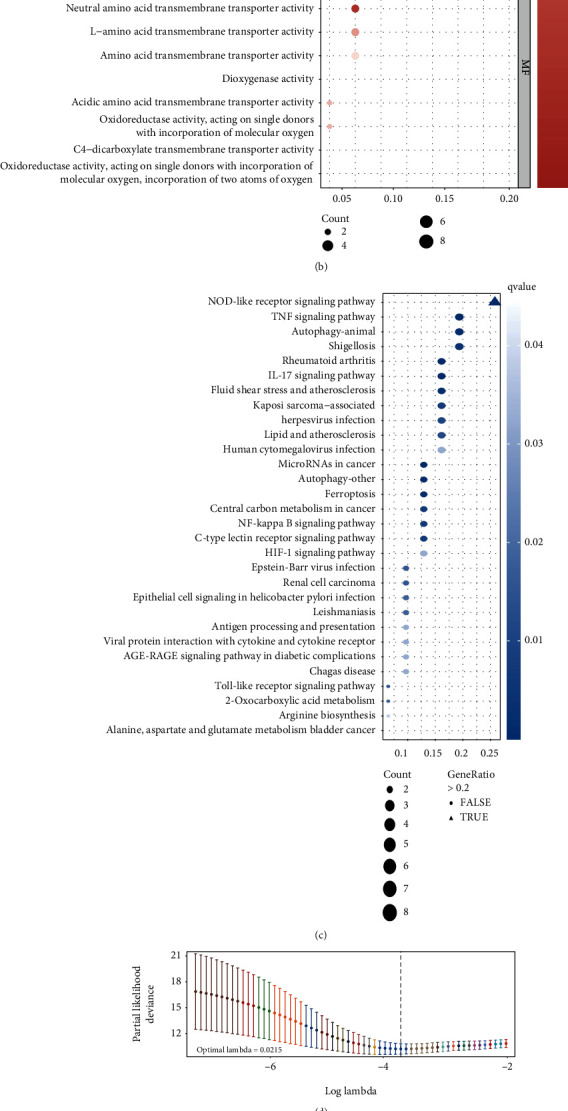
(a) Forest plot depicts 40 prognostic FRGs and the hazard ratios inferred from the outcome of univariate Cox regression analysis, 20 risk factors are marked in yellow, 20 protective factors in blue. (b) and (c) The top 10 pathways among biological process, cellular component, and molecular function in GO analysis (b), and top 30 in KEGG analysis (c) were shown in bubble plot, respectively, the bubble with gene-ratio > 0.2 is triangle shaped. (d) and (e) The least absolute shrinkage with 10-folded cross-validation, conducting candidate shrinkage to build the model. (f) and (g) The univariate and multivariate connections of risk score and other common clinical factors with OS. (h) DCA curves show that the risk score has the longest distance to the basic line. (i) Time-dependent ROC curves show the efficacy on prediction of the new model with AUC = 0.791 > 0.640.