Figure 3.

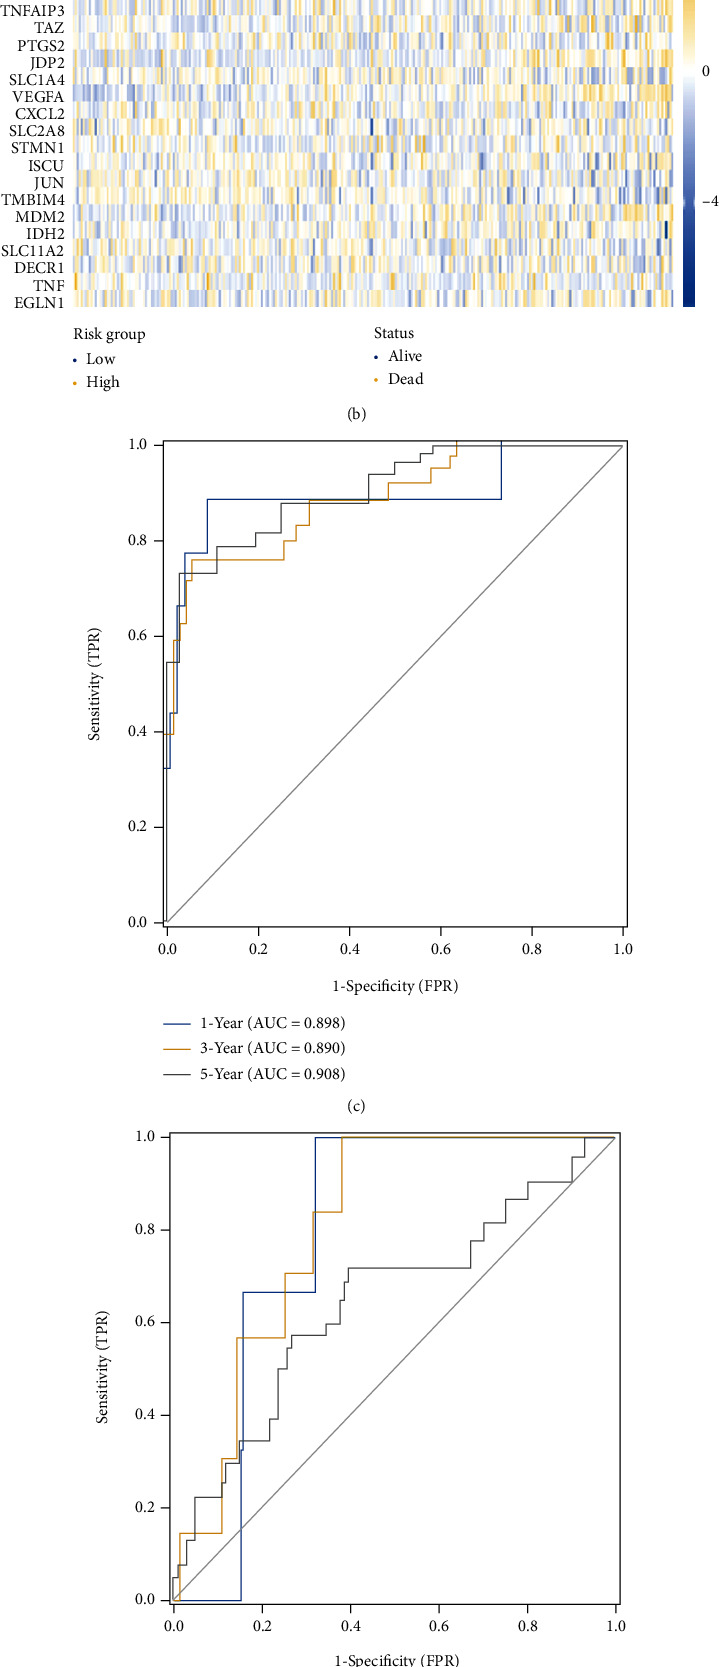
The risk-score distribution, expression heatmaps (a, b), time-dependent ROC curves on 1, 3, 5 year (c, d), as well as Kaplan-Meier curves (e, f) of USCS cohort and external validation GSE44001 dataset are exhibited.

The risk-score distribution, expression heatmaps (a, b), time-dependent ROC curves on 1, 3, 5 year (c, d), as well as Kaplan-Meier curves (e, f) of USCS cohort and external validation GSE44001 dataset are exhibited.