
Figure 5.
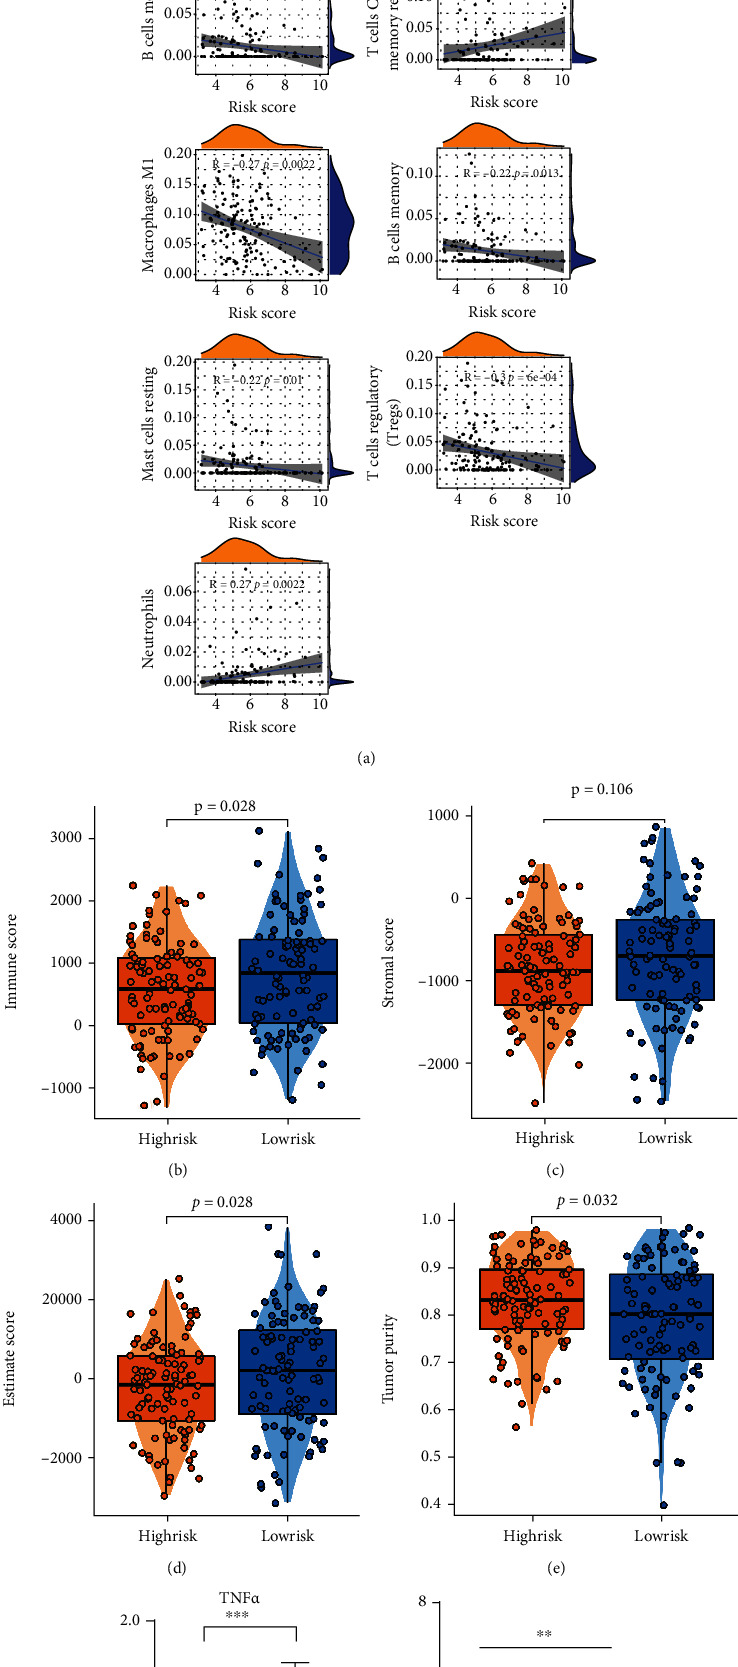
(a) Correlation analyses were made between the risk score and the infiltration of immune cells. The hill-shaped symbols on the top and right imply the density of the corresponding risk score or immune scoring. (b)–(e) The distributions of ESTIMATE-related scores and tumor purity were shown in box plots, low-group with 104 samples while high-group with 105, calculated by Weltch T-test. (F) The M1 biomarker TNFα increases after ferroptosis-induction (p < 0.001). (g) The result of ELISA test, SiHa-NC group with no addition of erastin, SiHa-Fe-Low group added with 10 μM erastin, SiHa-Fe-High group added with 20 μM erastin. TNFα secretion level was promoted by the increase of erastin concentration significantly (∗∗p < 0.01, ∗p < 0.05).