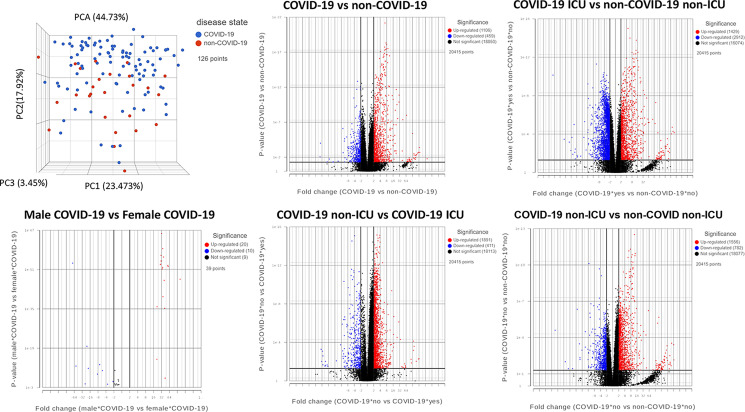
FIGURE 9.
Meta-analysis of COVID-19 and non–COVID-19 patients. PCA of patient samples grouped by disease, COVID-19 (blue) and non–COVID-19 (red). Groups include COVID-19–positive (COVID-19), COVID-19–negative (non–COVID-19), males positive for COVID-19 (Male COVID-19), females positive for COVID-19 (Female COVID-19), COVID-19 patients admitted to the ICU (COVID-19 ICU), COVID-19 patients not admitted to the ICU (COVID-19 non-ICU), non–COVID-19 patients admitted to the ICU (non–COVID-19 ICU), and non–COVID-19 patients not admitted to the ICU (non–COVID-19 non-ICU). Volcano plots of differential gene expression analysis filtered by significance of FDR ≤0.05 for the comparisons shown, where upregulated genes are shown in red, downregulated genes in blue, and not significant genes in black.

