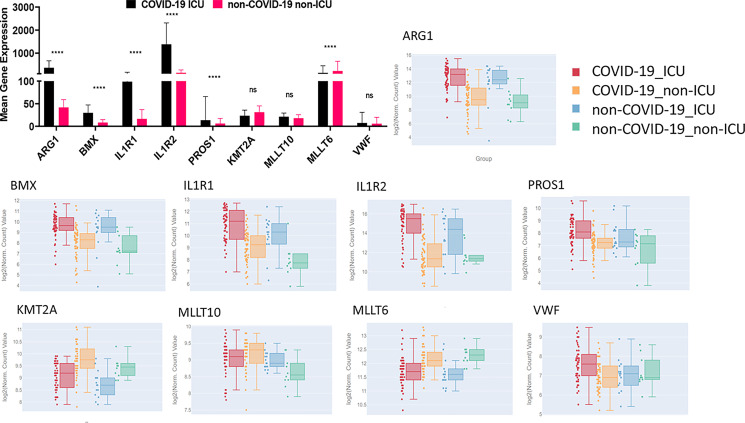
FIGURE 10.
Expression of select genes in plasma and leukocytes of COVID-19 patients. Mean gene expression of specific genes of interest in COVID-19 ICU patients (black) and non–COVID-19 non-ICU patients (pink) (top left). Significance represents p values calculated by differential gene analysis (GSA). The Web site–based tool provided [Overmyer et al. (18)] was used to generate the figures representing gene expression trends across all the groups, where COVID-19 ICU is red, COVID-19 non-ICU is yellow, non–COVID-19 ICU is blue, and non–COVID-19 non-ICU is green. Error bars represent SEM.

