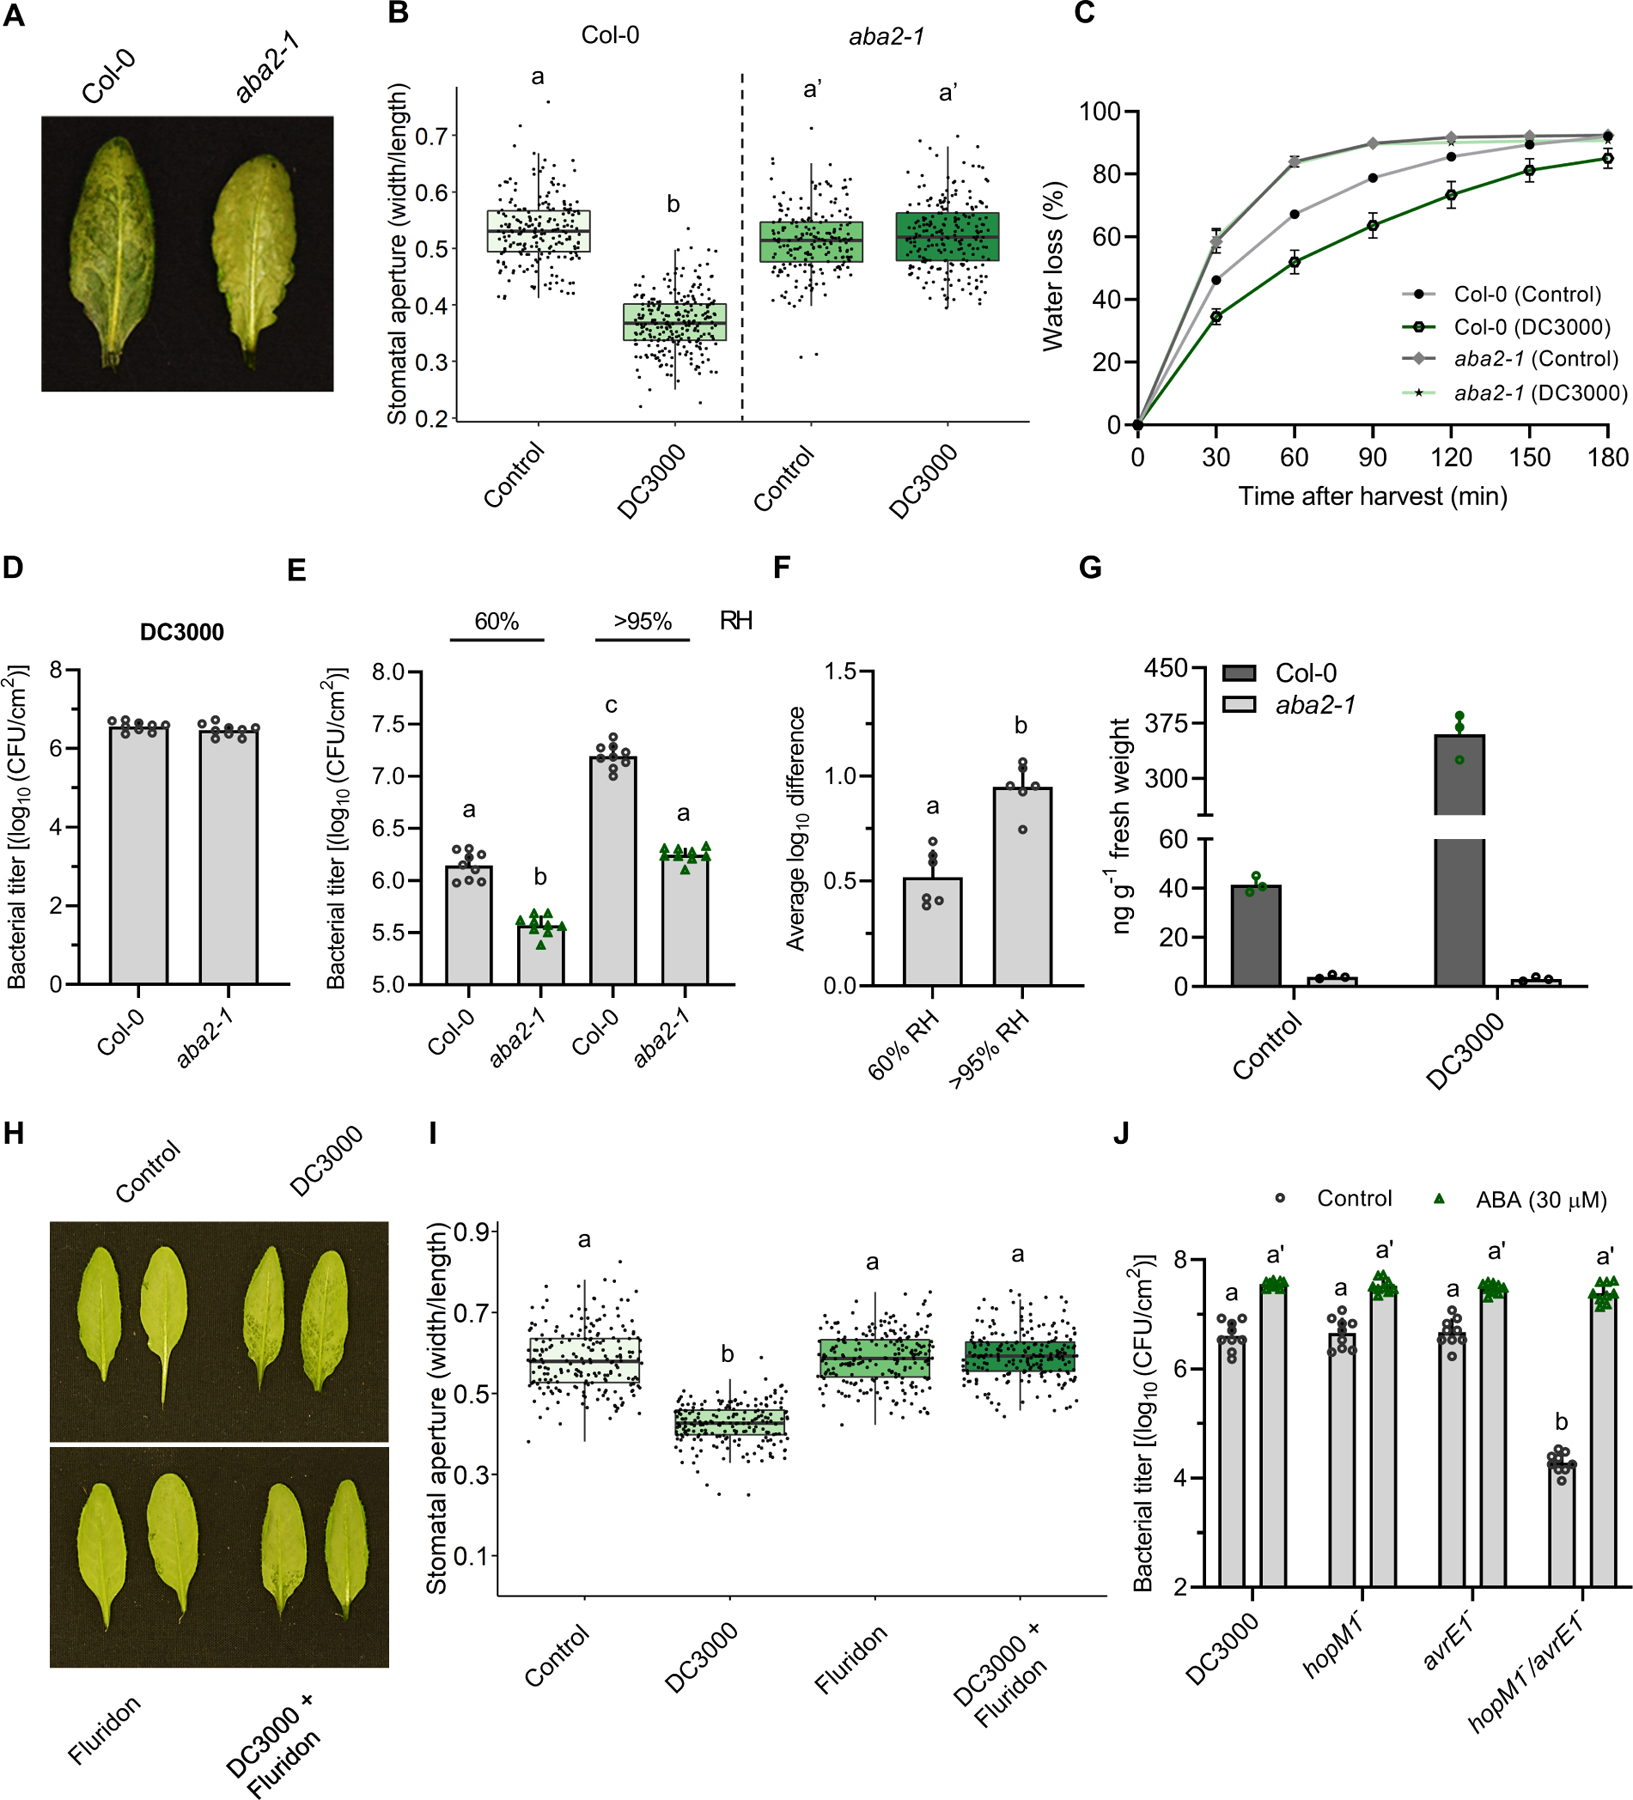
Figure 3. Abscisic acid biosynthesis is required for humidity-driven pathogenesis in Arabidopsis.

(A) Leaves of Col-0 Arabidopsis and the aba2–1 mutant were infiltrated with Pst DC3000 (1 × 10⁸ CFU/ml) and plants grown at 95% humidity. Photos taken at 24 hpi. (B) Stomatal aperture measurements of Col-0 and the aba2–1 mutant inoculated with Pst DC3000 under the same conditions as in (A) (n > 150 stomata). (C) Water loss was measured in leaves of Arabidopsis Col-0 and aba2–1 mutant plants inoculated with 10 mM MgCl2 (control) or Pst DC3000 (1 × 10⁸ CFU/ml). Leaves were detached at 24 hpi and stomata fixed in stomatal fixation solution at the beginning of water loss measurements. (D) Bacterial titres measured in plants analyzed in (A) at 24hpi. (E) Col-0 and aba2–1 mutant plants were infected with Pst DC3000 (1 × 10⁵ CFU/ml) and kept under either 60% or >95% RH levels. Bacterial titers were quantified 3 days post infection. (F) Average log difference in bacterial titers between WT and aba2–1 plants assayed under the conditions as in (E). (G) Quantification of ABA in Arabidopsis Col-0 and aba2–1 mutant plants mock inoculated (control) or inoculated with Pst DC3000 (1 × 10⁸ CFU/ml), as measured by UPLC-MS at 24 hpi. (H) Water-soaking lesion phenotypes in Arabidopsis leaves syringe-inoculated with MgCl2 10 mM (control), Pst DC3000 (1 × 10⁸ CFU/ml), fluridon (100 μM), or both Pst DC3000 and fluridon. (I) Stomatal aperture measurements from leaves described in (H). (J) ABA-mediated rescue of the hopM1−/avrE1− double mutant. Arabidopsis Col-0 plants were infected with the indicated Pst mutants (1 × 10⁵ CFU/ml) followed by treatment, at 2, 24, and 48 hpi, with either ABA (30 μM) or control solution (0.5% ethanol). Plants were treated at 2, 24 and 48 hpi. Treatments were carried out by spraying each solution on the abaxial and adaxial part of each plant. Bacterial titers were evaluated at 3 dpi. Data are represented as median values, with minimum and maximum values indicated (B, I) or as mean of total experimental replicates, ± SEM (C-–G, and J). Different letters indicate statistically significant differences, P < 0.0005, two-tailed Student’s t-test (B, F) or ANOVA (E, I, J).
