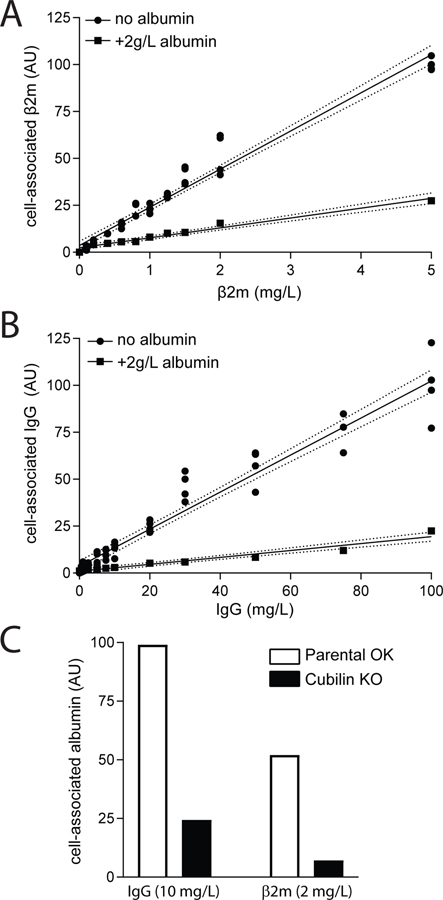
Figure 8.
Dose dependent uptake of β2m and IgG in PT cells. OK cells cultured on transwell supports under orbital shear stress were incubated with the indicated concentrations of Alexa Fluor-647 conjugated (A) β2m or (B) IgG for 15 min at 37°C. Cells were solubilized and cell-associated fluorescence quantified (circles). Individual data from four samples in two independent experiments are plotted. The fluid phase uptake component was estimated by inclusion of 2 g/L albumin in one filter at each ligand concentration (squares). Linear regression (solid line) with 95% confidence interval (dashed lines) is consistent with linear uptake across the concentration range tested (R2 = 0.963 and 0.941 for β2m and IgG, respectively). (C) Control (white bars) or CRISPR/Cas9 Cubn KO OK cells (black bars) were incubated as above with 2 mg/L β2m or 10 mg/L IgG and cell-associated fluorescence was quantified. Data from an individual point for each condition normalized to the IgG control are plotted for simplicity; however, comparable results were obtained using several other conditions for each ligand.

