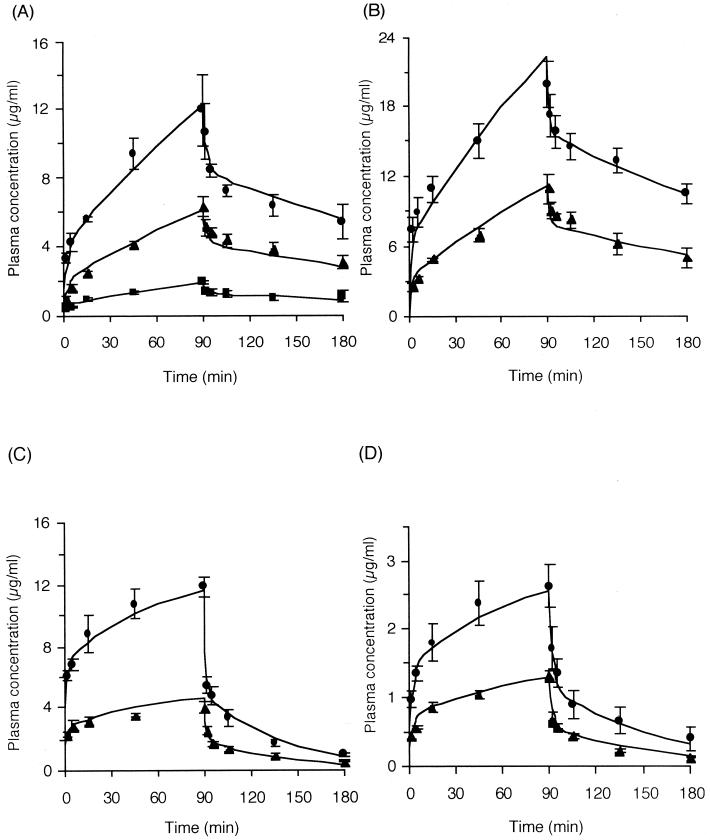
FIG. 3.
Time courses of the concentrations in plasma of CAM (■, 6.6 mg/kg/h [n = 3]; ▴, 21.6 mg/kg/h [n = 3]; ●, 43.2 mg/kg/h [n = 3]) (A), RXM (▴, 20 mg/kg/h [n = 4]; ●, 40 mg/kg/h [n = 3]) (B), and AZM (▴, 40 mg/kg/h [n = 3]; ●, 100 mg/kg/h [n = 3]) (C) compared with data previously reported by us (9) for EM (▴, 4.0 mg/kg/h [n = 4]; ●, 8.0 mg/kg/h [n = 4]) (D). Data are reported as mean and standard error of the mean.

