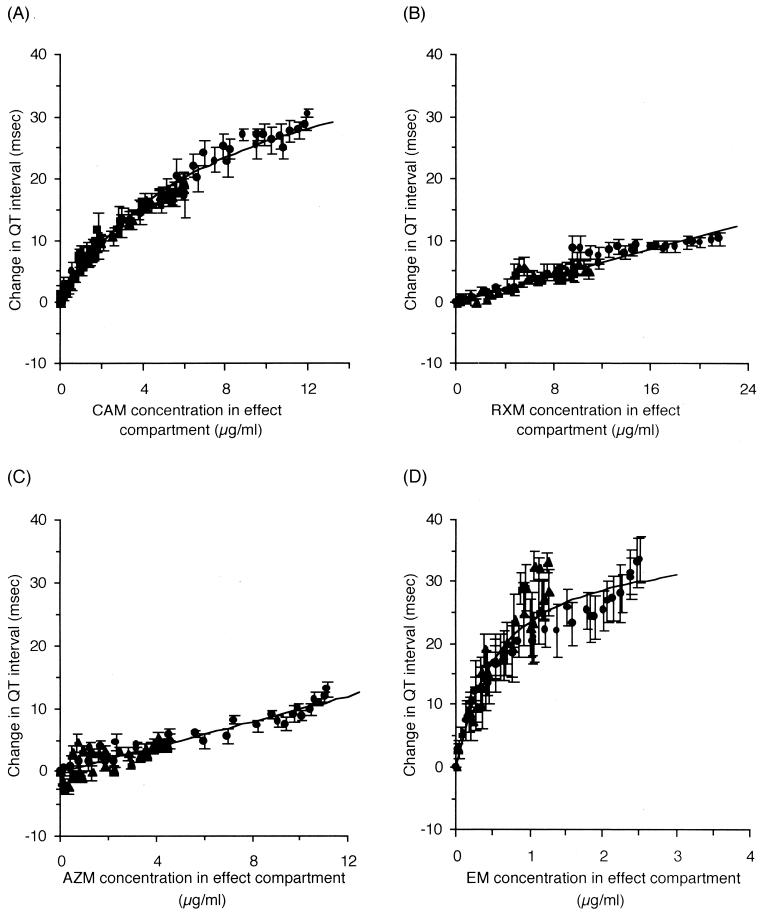
FIG. 5.
Relationships between drug concentrations in the effect compartment and changes in Q-T interval (n = 5 or 6). The lines calculated from equations 1 or 2 are superimposed. (A) CAM. (B) RXM. (C) AZM. (D) EM. (9). Data are reported as mean and standard error of the mean. Symbols are the same as for Fig. 2 and 3.

