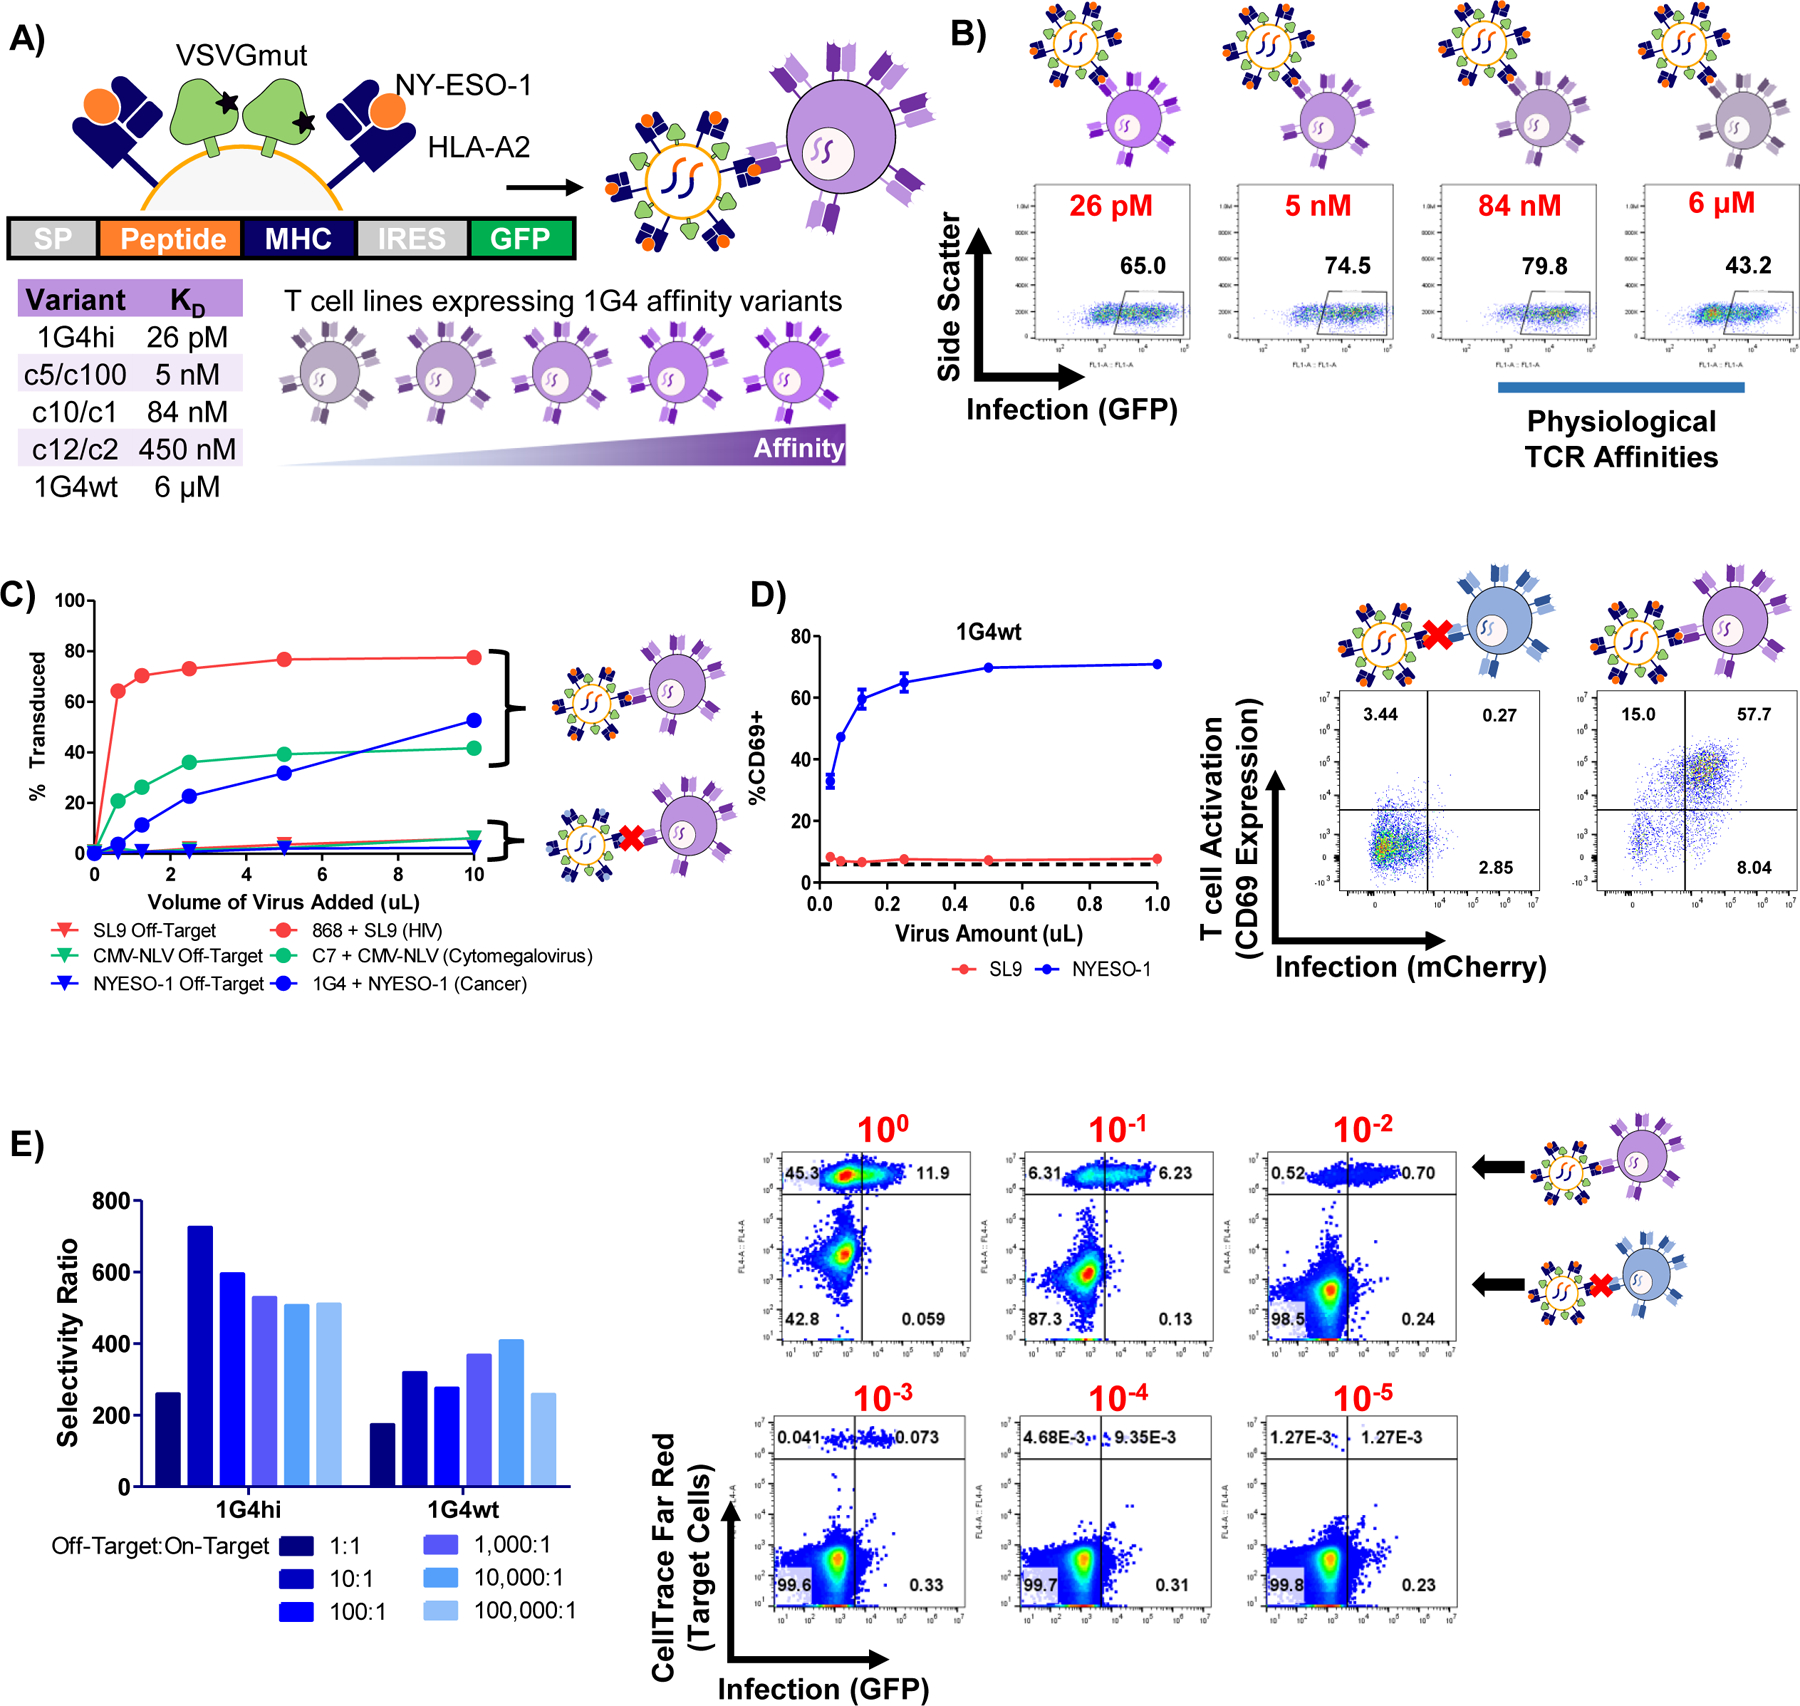
Figure 2 |. TCR-mediated infection is sensitive, specific, and induces signaling.

A, Schematic of the 1G4 TCR-HLA-A2/NY-ESO-1 system used for TCR-pMHC characterization. B, Representative infection data for various 1G4 TCR affinity variants by HLA-A2/NY-ESO-1 displaying VSVGmut lentiviruses. C, infection of J76 cells via specific TCR-pMHC interactions via pMHC-displaying VSVGmut lentiviruses for three independent TCR-pMHC pairs (HLA-A2/SL9-displaying viruses infecting 868 TCR-expressing J76 cells; HLA-A2/NLV-displaying viruses infecting C7 TCR-expressing J76 cells; HLA-A2-NY-ESO-1-displaying viruses infecting 1G4 TCR-expressing J76 cells). D, Upregulation of CD69 on J76 cells transduced with the 1G4wt TCR during viral entry; data shown represent mean + SD across three biological replicates, dashed line represents CD69 expression in untreated J76-1G4wt cells. E, Selectivity ratio of on target to off target infection of J76 cells expressing 1G4 TCR variants mixed at indicated ratios with off-target Jurkat cells; representative of three independent experiments, flow plots correspond to 1G4wt TCR-expressing J76 cells with target cell frequencies indicated in red. The selectivity ratio was calculated as the transduction rate of on-target cells divided by the transduction rate of off-target cells.
