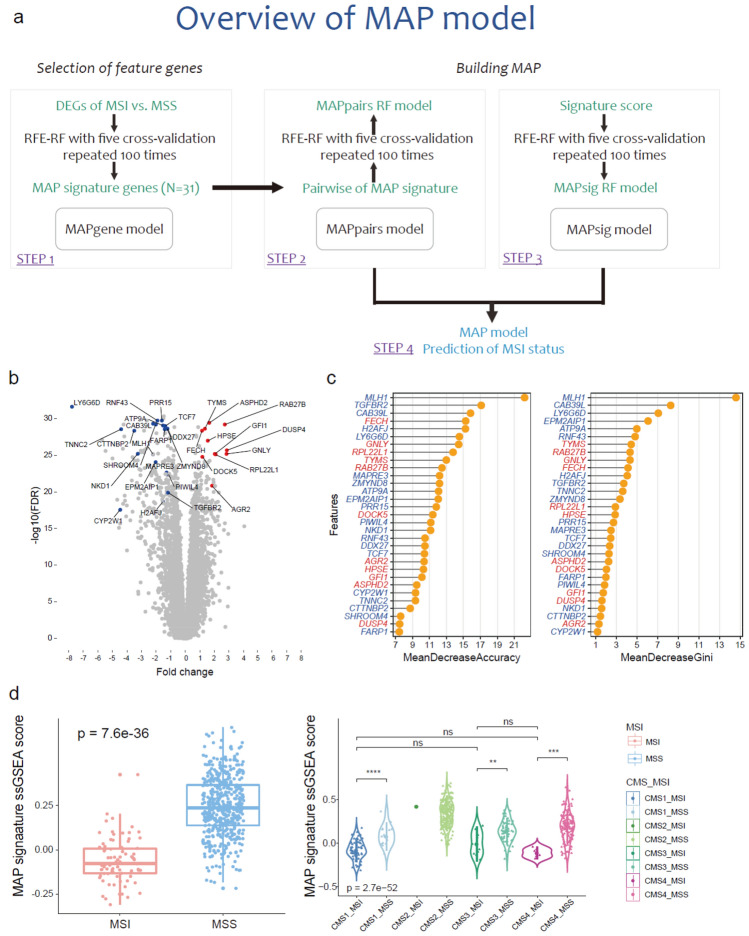
Figure 1.
Overview of the MAP model and designing the MAP signature from RFE-RF analysis of gene expression data. (a) Overview of the MAP model. MAP was developed through a workflow consisting of four strategies. (1) identification of the MAP signature (MAPgene model); (2) modeling based on pairwise gene expression of the MAP signature genes (MAPpairs model); (3) modeling based on ssGSEA scores of cancer-, molecular-, TME-, and immune-related signatures (MAPsig model); and (4) post-refinement of the final model and prediction of MSI status. (b) A volcano plot for DEGs between MSI and MSS samples. The x axis represents log2 fold changes in gene expression data for MSI versus MSS samples. Colored dots are significant DEGs in MAP signature; red and blue indicate up- and downregulated genes, respectively. (c) The importance of 31 features is based on accuracy and Gini index scores. The mean decrease in accuracy is a measure of how much influence it has in improving classification accuracy. The mean decrease in Gini is a measure of how impurity can be reduced by features used when separating nodes. The genes with red and blue colors indicate up- and downregulated genes in MSI, compared with MSS, respectively. (d) MAP signature. A box-plot of MAP signature ssGSEA scores according to MSI status (left) and CMS-MSI and MSS subtypes (right). The dots represent samples. MAP signature scores differ significantly between MSI and MSS samples independent of CMS subtypes. CMS2-MSI did not confirm statistical significance because the number of samples was small. * P < 0.05, ** P < 0.01, *** P < 0.005. DEG; differentially expressed gene, MSI; microsatellite instability, MSS; microsatellite stability, RFE-RF; recursive feature elimination-random forest, CMS; consensus molecular subtype, ssGSEA; single-sample gene set enrichment analysis, FDR; false discovery rate.

