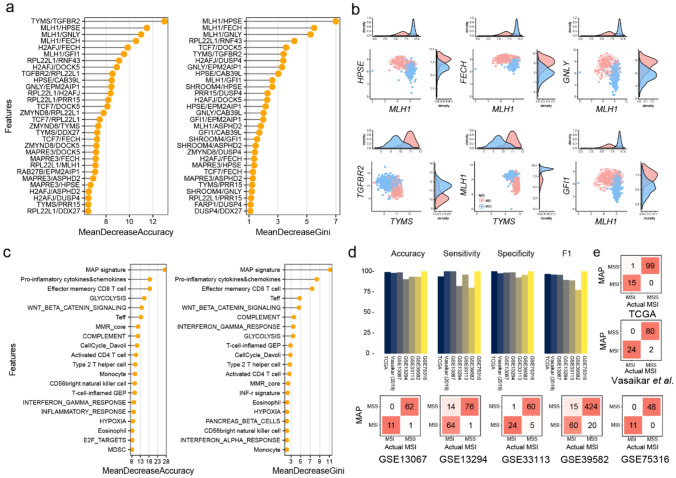
Figure 2.
MAP model. (a) Top 30 important features of the MAPpairs model. The mean decrease in accuracy (left) is a measure of how much influence a feature has in improving classification accuracy. The mean decrease in Gini (right) is a measure of how impurity can be reduced by features used when separating nodes. (b) A scatter plot and histogram of the gene pairs. The relationship between the expression of two genes in the MSI and MSS groups can be confirmed through a scatter plot, and the expression value of each gene can be confirmed through the density plots at the upper and lower right corners. MLH1-related rules and TFGBR2/TYMS rule are shown. (c) Top 20 important features (signatures) of the MAPsig model. (d) Performance (accuracy, sensitive, specificity, and F1) of the MAP model. (e) Confusion matrices of the validation dataset. The actual MSI means MSI status provided in the dataset study. The red color-scale reflects percentages of class predictions against the actual class.

