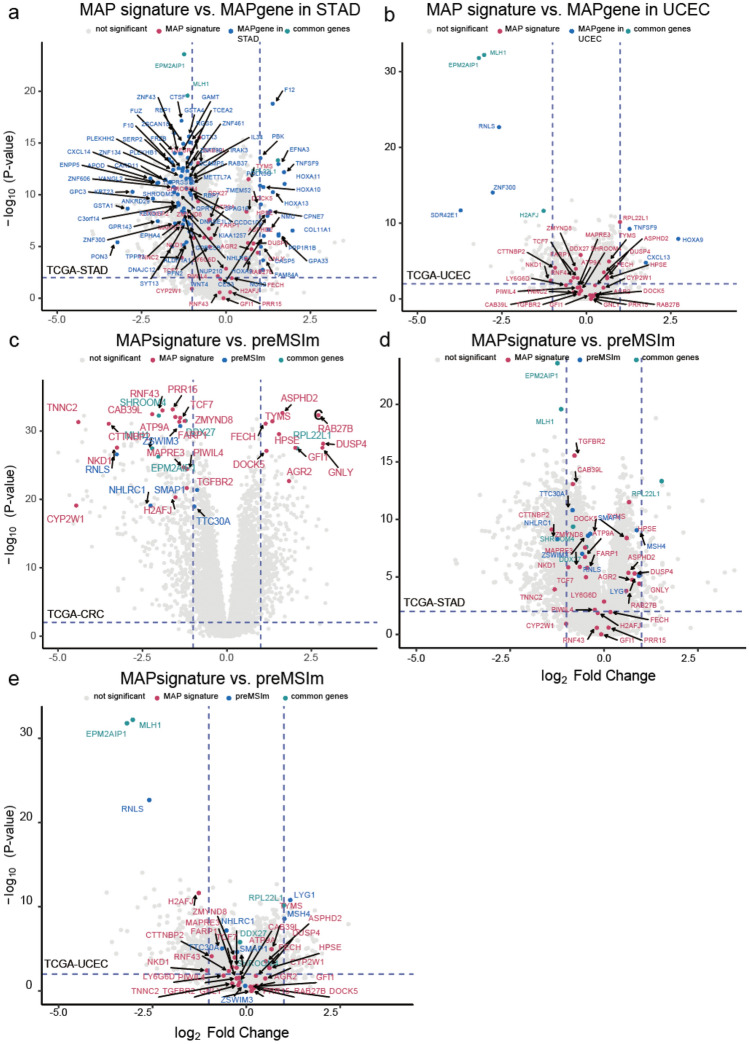
Figure 3.
MSI signatures. (a) MAP signature and UCEC MSI signature on TCGA-UCEC. (b) MAP signature and STAD MSI signature on TCGA-STAD. (c) MAP signature and preMSIm signature on TCGA-COADREAD. (d) MAP signature and preMSIm signature on TCGA-STAD. (e) MAP signature and preMSIm signature on TCGA-UCEC. The x-axis represents log2 fold changes in gene expression data for MSI versus MSS samples. The colored dots mean the genes of the corresponding signatures marked in each panel. The blue dotted line on the x-axis means − 1 and 1 of the log2 fold change scale, and 2 (− log10(0.01)) on the y-axis.

