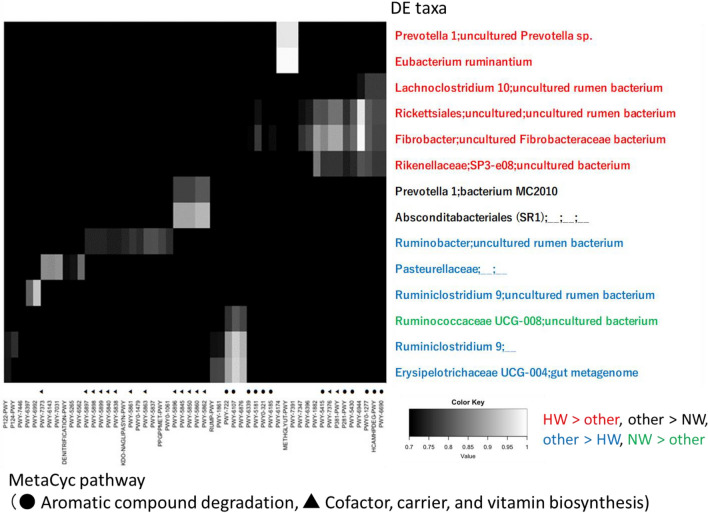
Figure 11.
Pearson correlation coefficients between the results of 16S rRNA amplicon-seq and PICRUSt2 in the ruminal bacterial composition. The taxonomy_7_levels.txt file in the SILVA database was used for annotation of bacterial OTUs in the amplicon-seq data. The color of the DE taxa indicates a statistically significant difference among the groups (q < 0.01) analyzed by TCC baySeq. PICRUSt2 analysis was performed with dada2 output in QIIME2. The MetaCyc pathway was searched in the PICRUSt2 pipeline. Correlations with a coefficient between 0.7 and 1.0 are shown. Aromatic compound degradation and cofactor, carrier, and vitamin biosynthesis are shown as filled circles and triangles, respectively.

