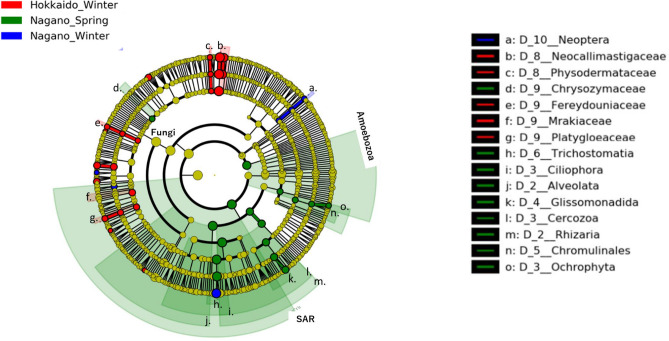
Figure 8.
Cladograms of eukaryotic taxa in ruminal eukaryal composition detected by the LEfSe approach. Red, green, and blue indicate significantly different groups (Hokkaido winter, Nagano spring, and Nagano winter, respectively), with the diagram and species classification at the phylum, class, order, family, and genus levels shown from the inside to the outside. Yellow circles represent species with no significant difference. Letters in the cladograms indicate the significantly different taxa in each clade including more than 2 taxa. Eukaryotic taxa excluded chloroplasts and host mitochondria from 18S rRNA amplicon-seq analysis.

