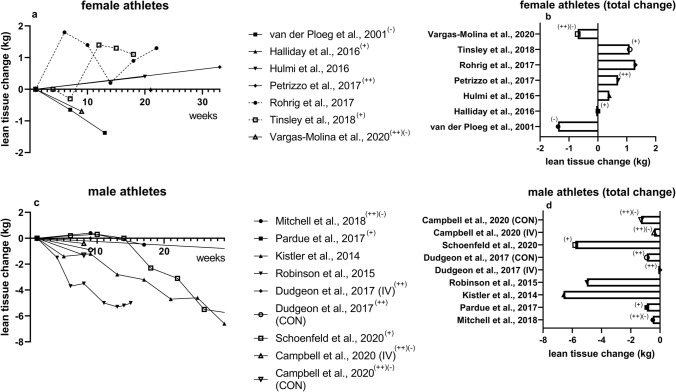
Fig. 2.
Time course of lean tissue changes during CR in kilograms. Longitudinal depiction of (a) female and (c) male athletes as well as absolute visualization of (b) female and (d) male athletes. (+) indicates (self-reported) high-volume RT; (++) indicates progressive overload over time, (-) indicates reduced volume; without symbols means that volume tendency could not be specified; Stratton et al. 2020 was not included due to missing whole-body lean mass data. CON control group, IV intervention group

