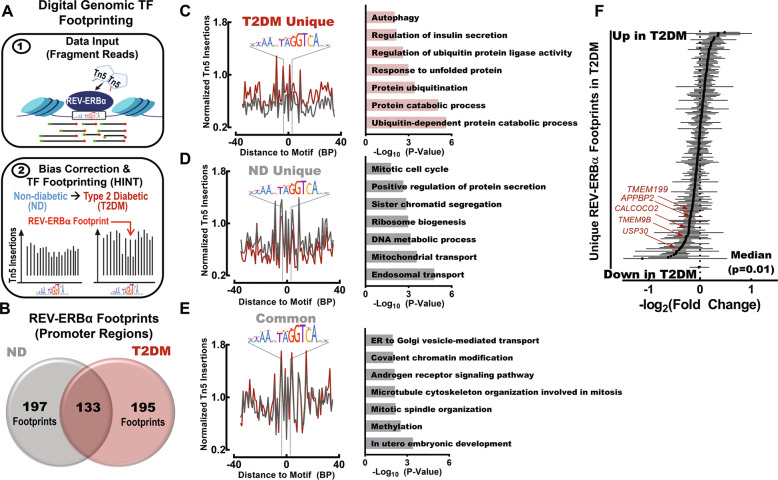
Fig. 9. REV-ERBα preferentially binds to promoter regions of genes regulating protein degradation and autophagy in T2DM human islets.
A Schematic outlining digital genomic transcription factor (TF) footprinting from ATAC-seq of ND and T2DM islet samples (SRP117935) [35]. Transcription factors (e.g., REV-ERBα) protect against Tn5 digestion, resulting in a local decrease in chromatin accessibility (‘footprint’). This enables for identification and differential analysis of transcription factor binding at regulatory motifs in non-diabetic (ND) versus Type 2 Diabetic (T2DM) islets using the Hmm-based IdeNtification of Transcription factor footprint framework (HINT) [36]. B Venn diagram highlighting the overlap of REV-ERBα footprints identified in promoter regions (±1 kb from TSS) from at least two ND and/or T2DM islet samples (n = 5 ND and n = 5 T2DM samples). C–E (left): Representative ND and T2DM REV-ERBα footprints uniquely observed in T2DM islets (top), uniquely in ND islets (middle), and common (bottom) in both ND and T2DM islets within promoter regions. The signal is normalized to the total read depth of each sample and is plotted ±35 bp from the REV-ERBα motif center. C–E (right): Enriched GO: Biological Process pathways annotated from T2DM unique (top), ND unique (middle), and common (bottom) REV-ERBα footprints in promoter regions. F Forrest plot illustrating results of the meta-analysis for genes annotated as REV-ERBα footprints (unique to T2DM) derived from 5 publicly available human islet microarray datasets comparing the transcriptome of non-diabetic and type 2 diabetic islets (GSE38642 [63], GSE 25724 [64], GSE20966 [65], GSE76894 [66], and GSE76895 [66]). Red arrows highlight common genetic regulators of autophagy and protein degradation in T2DM.

