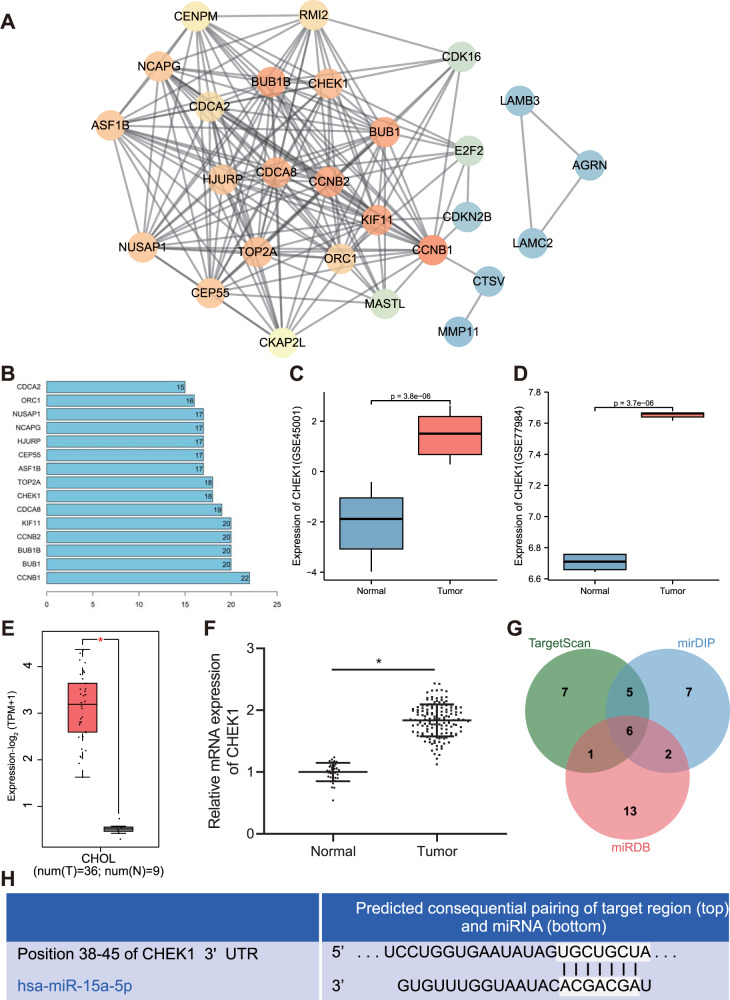
Fig. 1. Bioinformatics analysis predicts the differentially expressed genes and their molecular interactions in CCA.
A Interaction network of 50 differentially expressed genes in CCA-microarray GSE26566. Each cycle indicates a gene and the line between two cycles represents the interaction between two genes. More interaction genes of each gene show higher degree value, which display higher core degree with deeper color. B Degree value of the genes with a degree value higher than 15. The abscissa represents degree value and the ordinate represents gene names. C A box plot of CHEK1 expression in the GSE45001 microarray data (10 CCA samples and 10 normal samples). D A box plot of CHEK1 expression in the GSE77984 microarray data (3 CCA samples and 4 normal samples). E Differential expression of CHEK1 in CCA samples in TCGA and GTEx databases. The abscissa represents sample type and the ordinate represents gene expression. The red box indicates tumor sample and gray box indicates normal sample (*P < 0.01). F CHEK1 expression in CCA samples (n = 145) and normal samples (n = 35) determined by RT-qPCR. *means comparison against normal samples, P < 0.05. G Prediction of upstream miRNAs regulating CHEK1. The three circles in the figure represent the prediction results of the TargetScan, mirDIP, and miRDB databases, and the central part represents the intersection of the three databases. H The binding affinity of miR-15a-5p to CHEK1 as well as the binding site of miR-15a-5p in the 3’UTR of CHEK1 mRNA predicted by TargetscanHuman. The data are presented as mean ± standard deviation. Comparison between two groups was conducted using unpaired t-test.

