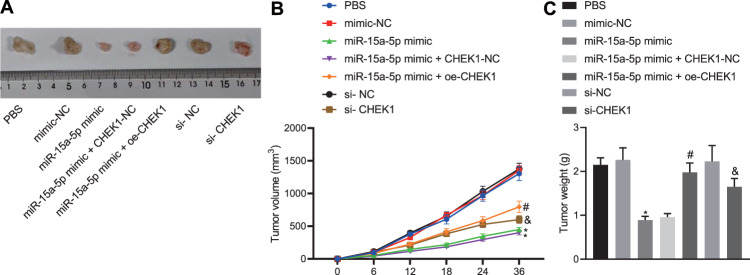
Fig. 5. miR-15a-5p retards the tumorigenesis by inhibiting CHEK1 expression in vivo.
A Images of the removed xenograft tumors. B Dynamic volume curve of xenograft tumors in vivo. C Weight of the removed xenograft tumors. In panels A–C, HuCCT1 cells treated by miR-15a-5p mimic, miR-15a-5p mimic + oe-CHEK1, si-CHEK1, their corresponding controls and PBS were individually subcutaneously injected into nude mice to construct nude mouse models of xenografts. The data are presented as mean ± standard deviation. Comparison to control group was conducted using paired t-test; the values at multiple groups were compared using one-way ANOVA followed by Tukey’s post-hoc tests; the values at different time points were compared using repeated measures ANOVA followed by Bonferroni pairwise comparison; *means comparison against the mimic NC group, P < 0.05. #means comparison against miR-15a-5p mimic + CHEK1-NC group, P < 0.05; &means comparison against the si-NC group, P < 0.05. n = 6 for mice in each group.

