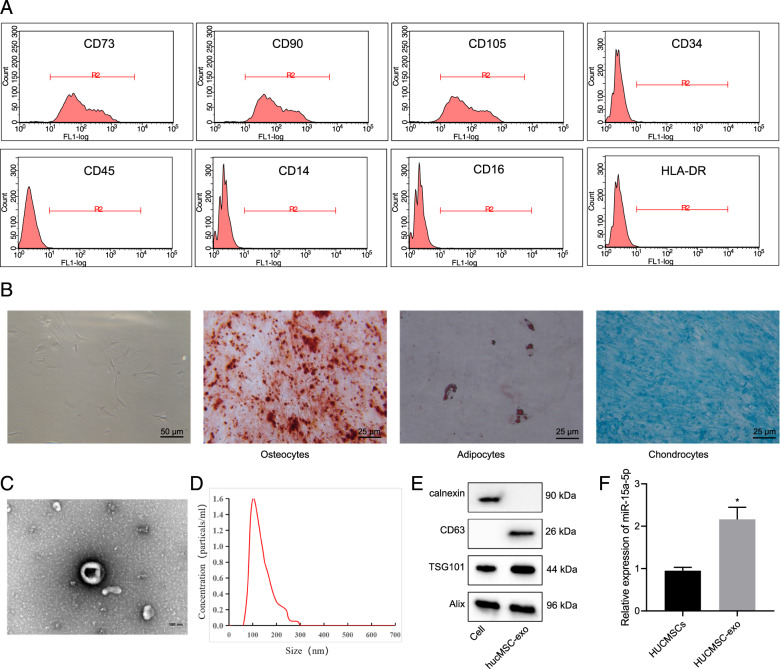
Fig. 6. miR-15a-5p is highly expressed in HUCMSCs and HUCMSCs-exo.
A Flow Cytometry detection of cell surface markers of HUCMSCs. B Observation of cell morphology and identification of differentiation-capacity under an inverted microscope. From left to right: Cell morphology was observed under an inverted microscope, bar = 50 μm; differentiation of osteoblasts was confirmed using Alizarin Red staining, bar = 25 μm; differentiation of adipocytes was assessed using Oil Red staining, bar = 25 μm; differentiation of chondroblasts was identified using Alcian Blue staining, bar = 25 μm. C TEM evaluation of exosome morphology. Bar = 100 μm. D NTA of particle size distribution of exosome. E Western blot assay of expression of the exosomal marker using ALIX, CD63 and TSG101 antibodies; calnexin antibody served as a NC. F Quantitative amplified results of level of miR-15a-5p in HUCMSCs and HUCMSCs-exo. Comparison to the control group was conducted using independent sample t-test; *means comparison against HUCMSCs, P < 0.05. The data are presented as mean ± standard deviation. Cell experiments were repeated three times independently.

