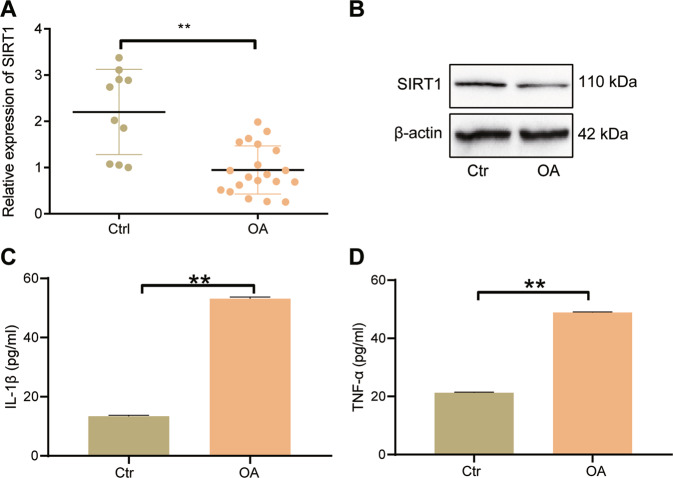
Fig. 2. Quantification of SIRT1 expression and inflammatory factor production in patients with OA.
A qRT-PCR to detect the expression of SIRT1 mRNA in normal cartilage tissue (n = 10) and OA cartilage tissue (n = 20). B Western blot to detect the expression of SIRT1 protein in normal cartilage tissue (n = 10) and OA cartilage tissue (n = 20). C ELISA to detect the level of IL-1β in serum of OA patients (n = 20). D ELISA to detect the level of TNF-α in serum of OA patients (n = 20). **p < 0.01 compared with Ctrl group.

