Figure 3.
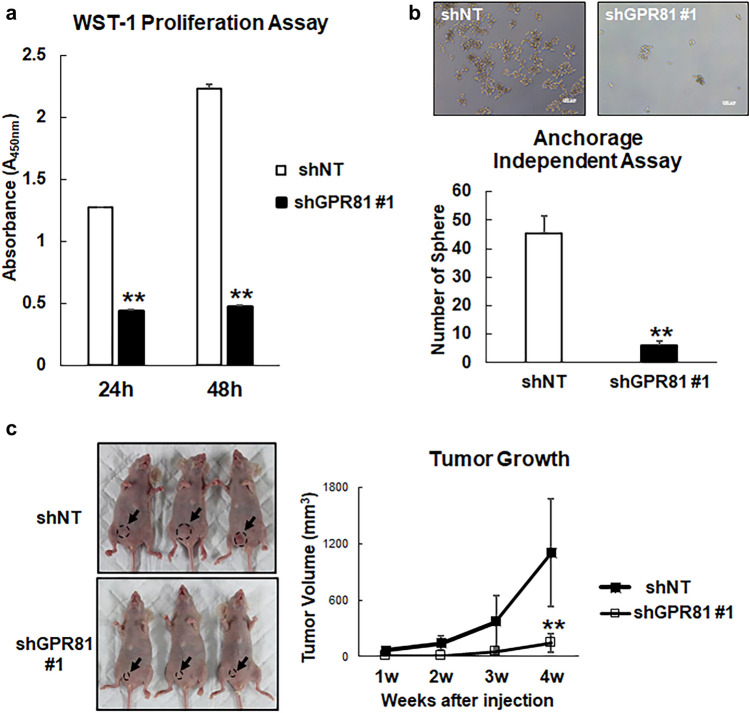
Decrease in cell proliferation and tumor growth of shGPR81 MDA-MB-231 cells. (a) ShNT and shGPR81 #1 cells were cultured in 96 well plates, and cell proliferation was determined using the WST-1 Proliferation Assay Kit (n = 5/group). **p < 0.01 (vs. shNT cells); Student’s t-test. (b) Anchorage-independent cell growth of shNT and shGPR81 cells. ShNT and shGPR81 cells were cultured in EZ-BindShut microplates for 7 days, and the number of spheres were counted using a light microscope. The upper panel shows representative micrographs of spheres generated from shNT and shGPR81 cells. Scale bars 100 μm (top). Sphere-forming potential of shNT and shGPR81 cells (mean ± s.d.; n = 3). **p < 0.01 (vs. shNT cells); Student’s t-test (bottom). (c) Representative images of MDA-MB-231 shNT and shGPR81 #1 xenografts at 4 weeks after tumor cell injection (left). Tumor volumes of shNT and shGPR81 #1 xenografts were measured over a period of 4 weeks after cell injection (right; n = 5/group). **p < 0.01 (vs. shNT cells); Student’s t-test.

