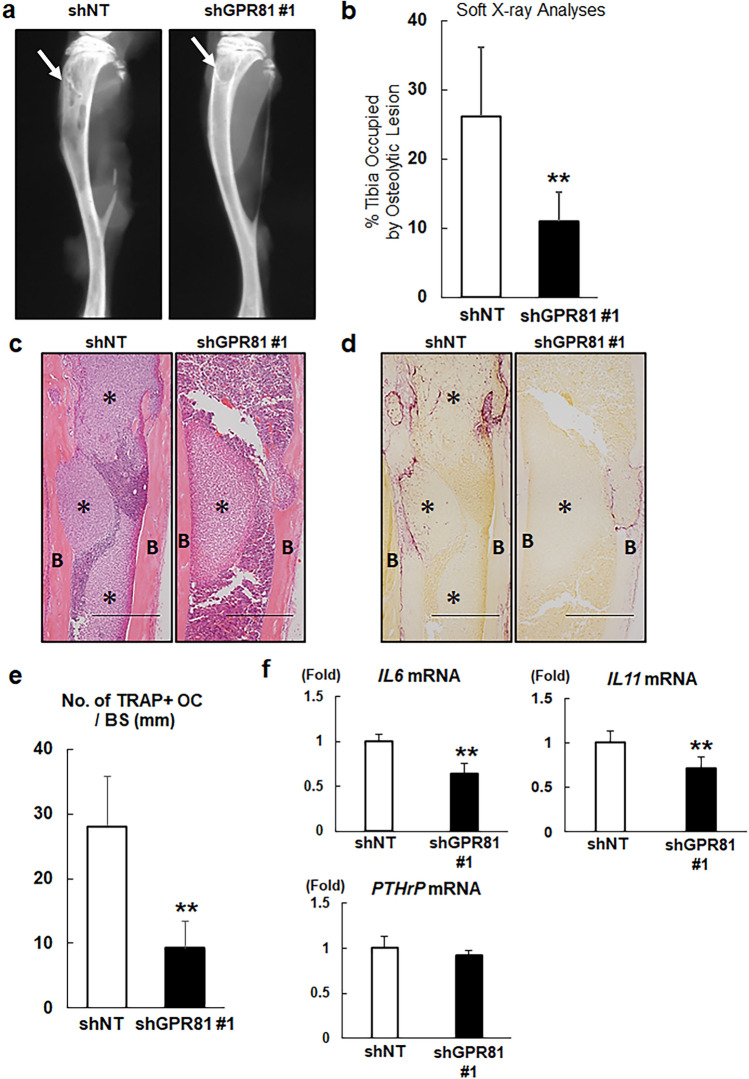
Figure 5.
Impaired osteolytic tumor growth of shGPR81-transduced MDA-MB-231 cells. (a) Soft X-ray analysis of the hind limbs of mice after bone marrow injections with 1 × 10⁵ shNT or shGPR81 #1 cells. The arrowheads indicate the osteolytic lesions. (b) Osteolytic destruction was quantified by measuring the areas of the osteolytic lesions in digital X-ray images. The data are presented as the percentage of the tibia occupied by osteolytic lesions (n = 9 mice/group). **p < 0.01 (vs. shNT cells); Student’s t-test. (c) Hematoxylin and eosin staining of histological sections of the tibiae collected from the mice shown in panel (a). B: cortical bone, *: tumor. Scale bars 500 μm (d) Tartrate-resistant acid phosphatase (TRAP) staining of serial sections presented in panel (c). Note that TRAP-positive osteoclasts aligned at the endosteal surfaces. B: cortical bone, *: tumor. Scale bars 500 μm (e) The number of TRAP-positive osteoclasts per bone surface (no. of TRAP + OC/BS) was measured using a light microscope (mean ± s.d., n = 5/group). **p < 0.01 (vs. shNT); Student’s t-test. (f) Total RNA was isolated from shNT and shGPR81 #1 cells, and IL6, IL11, and PTHrP mRNA expression was analyzed by RT-qPCR. Data are shown as fold changes normalized to shNT (mean ± s.d., n = 3/group). **p < 0.01 (vs. shNT); Student’s t-test.

