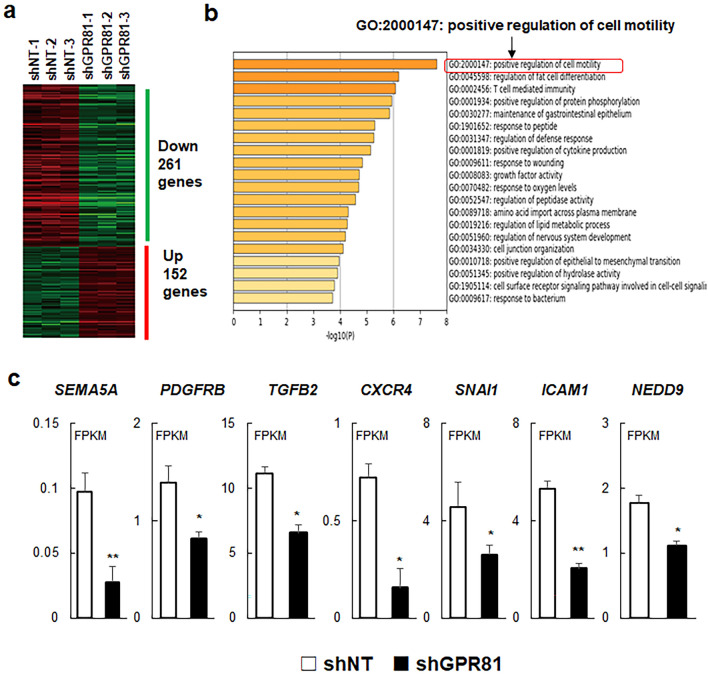
Figure 6.
Decreased expression of genes associated with cell motility in shGPR81 cells. (a) Heatmap of differentially expressed genes in shNT and shGPR81 cells. Differentially expressed genes (false discovery rate cut off of < 0.05; minimal fold change > 1.5) were identified using the iDEP.94 database. (b) Enriched Gene Ontology clusters of downregulated genes. Gene enrichment analysis was performed using the web-based platform Metascape. Note that the positive regulation of cell motility data set showed the greatest enrichment of downregulated genes for shGPR81 cells. (c) The mRNA expression of cell motility genes in shNT and shGPR81 cells. The mRNA expression data are presented as fragments per kilobase per million mapped reads (FPKM) (mean ± s.d., n = 3/group). **p < 0.01 (vs. shNT); Student’s t-test.

