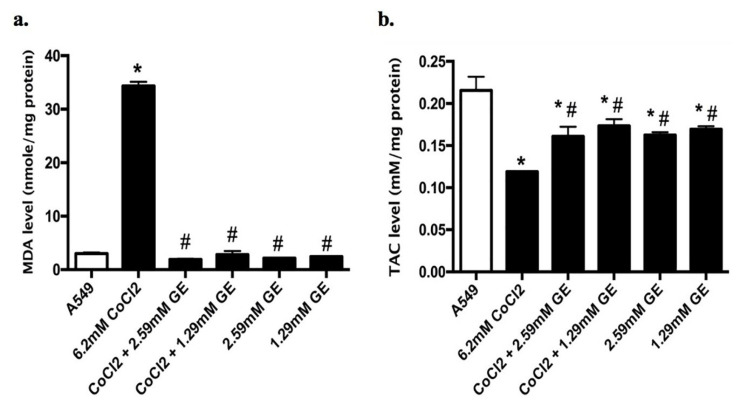
Figure 4.
Levels of (a) MDA and (b) TAC in A549 cells treated with GE (2.59 and 1.29mM) and CoCl2 6.2mM) either alone or in combination for 24 h exposure using ELISA Kit. Data expressed as nM/mg protein. (*) significantly different from A549 group (P < 0.05), (#) significantly different from 6.2mM CoCl2 group (P < 0.05). The figure shows the mean ± SD of averages from triplicate data of three separate experiments.

