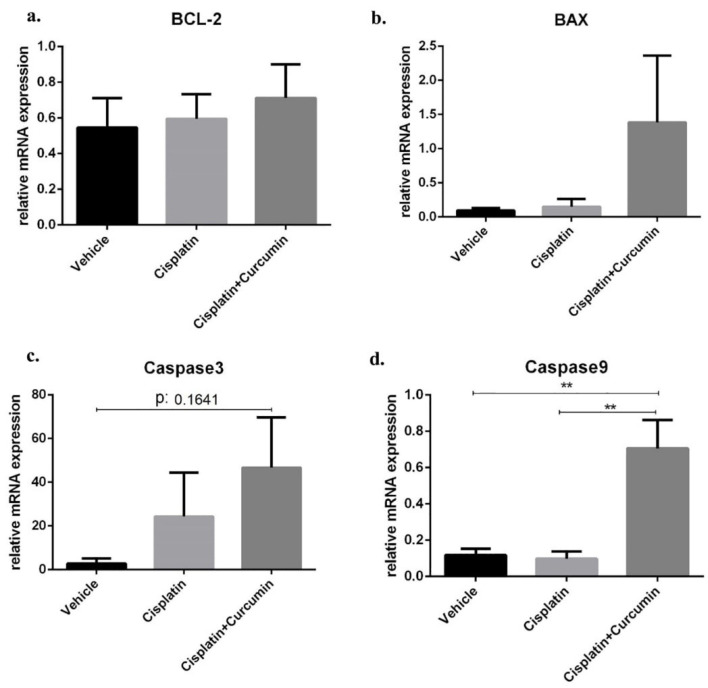
Figure 3.
Apoptotic marker at mRNA level in SKOV3 cells after cisplatin ± curcumin treatment. (a) Bax expression marker, (b) BCL-2 expression marker, (c) caspase3 expression marker, (d) caspase9 expression marker. Non-repeated ANOVA with post hoc analysis of Fisher’s PLSD was used for statistical analysis. Data are presented as mean ± SE. *P < 0.05, **P < 0.01, *** P < 0.001, and **** P < 0.0001 (n=4, each group).

